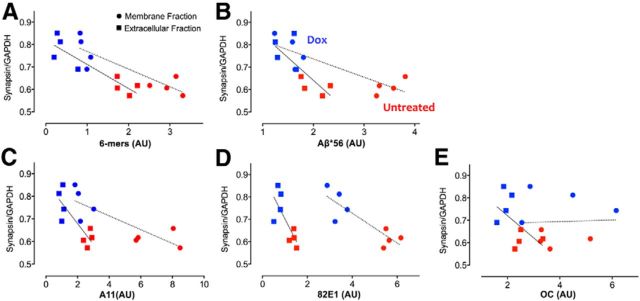
Figure 9.
Synaptic protein expression correlates with oligomeric Aβ levels. A, B, Graphs showing the level of synapsin protein measured by Western blot of intracellular tissue extract as a function of the amount of Aβ*56 (A) Aβ hexamer (B) measured by Western blot of extracellular (squares) or membrane extract (circles) from the same animal. C–E, Graph showing synapsin expression as a function of A11-positive (C) and 82E1-positive (D) oligomeric Aβ or OC-positive fibrils (E) measured by dot blot. Values are expressed as arbitrary units (AU). Red, n = 4 untreated; blue, n = 4 dox.

