Figure 1.
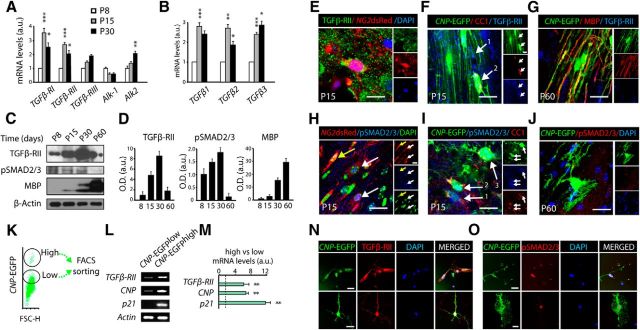
TGFβ signaling pathway elements are expressed in OL lineage cells. A, B, Real-time PCR analysis of TGFβ signaling receptors (A) and ligands (B) from SCWM extracted at P8, P15, and P30. Results show that the expression of TGFβ-RI and II; Alk2; and TGFβ1, 2, and 3 in the SCWM peaks at P15–P30. Note that TGFβ-RIII and Alk1 were not found to be temporally regulated. Results are expressed in arbitrary units after actin normalization. C, D, Analysis of TGFβ-RII, pSMAD2/3, and MBP expression levels by WB during postnatal myelination (P8–P60), performed with SCWM protein extracts. E–J, Immunohistochemistry analysis demonstrates that TGF-βRII and its downstream targets pSMAD2/3 are expressed at the onset of myelination. At P15, TGFβ-RII (E, F) and pSMAD2/3 (H, I) are present in both, OPs (NG2dsRed+ cells and CNP-EGFPlow CC1neg, E, F1, H, and I1) and pre-OLs (CNP-EGFPhigh CC1+, F2 and I2). G, J, At P60 both TGFβ-RII and pSMAD2/3 were downregulated after the main process of SCWM myelination. K–O, CNP-EGFPlow OPs were FACS sorted and analyzed by RT-PCR or cultured in vitro. K, A typical FACS plot diagram of CNP-EGFP+ cells isolated at P5 from SCWM tissue of the CNP-EGFP mouse. L, M, Real-time PCR analysis of mRNA extracted from CNP-EGFPlow (OPs) and CNP-EGFPhigh (pre-OL) FACS-sorted cells. N, O, Immunofluorescence of TGFβ-RII (N) and pSMAD2/3 (O) in CNP-EGFPlow FACS-sorted cells cultured under differentiating conditions. Note that we found higher levels of TGFβ-RII and pSMAD2/3 in cells undergoing OL differentiation compared with OPs. Results are expressed in arbitrary units after actin normalization. Data are shown as mean ± SEM; n = 4 brains for each time point. Scale bars: E–J, 5 μm; N, O, 3 μm. *p < 0.05; **p < 0.01, ***p < 0.001.

