
FIGURE 18.
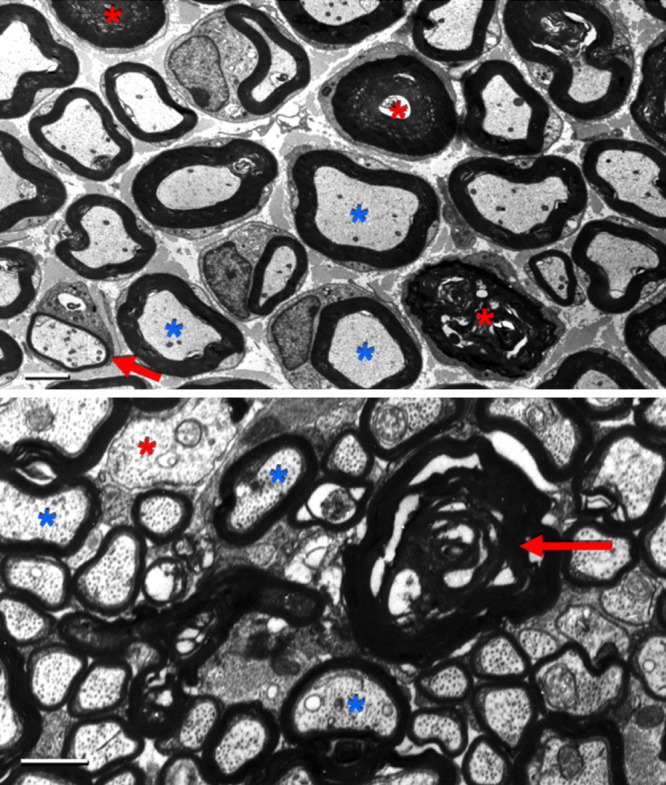
Axon degeneration in complex ganglioside knockout (B4galnt1-null) mice. Top: pathological features in PNS (sciatic nerve). Low-power electron microscopic image showing axon degeneration with collapsed myelin (red asterisks) and a thinly myelinated fiber surrounded by supernumerary Schwann cell process (red arrow). Normal myelin is denoted with a blue asterisk for comparison. Scale bar = 2.5 μm. Bottom: pathological features in the CNS (optic nerve). Electron microscopic image showing axonal degeneration and myelin collapse (red arrow), and a large unmyelinated axon (red asterisk). Normal myelin is denoted with a blue asterisk for comparison. Scale bar = 200 nm. [Adapted from Sheikh et al. (447).]