
FIGURE 9.
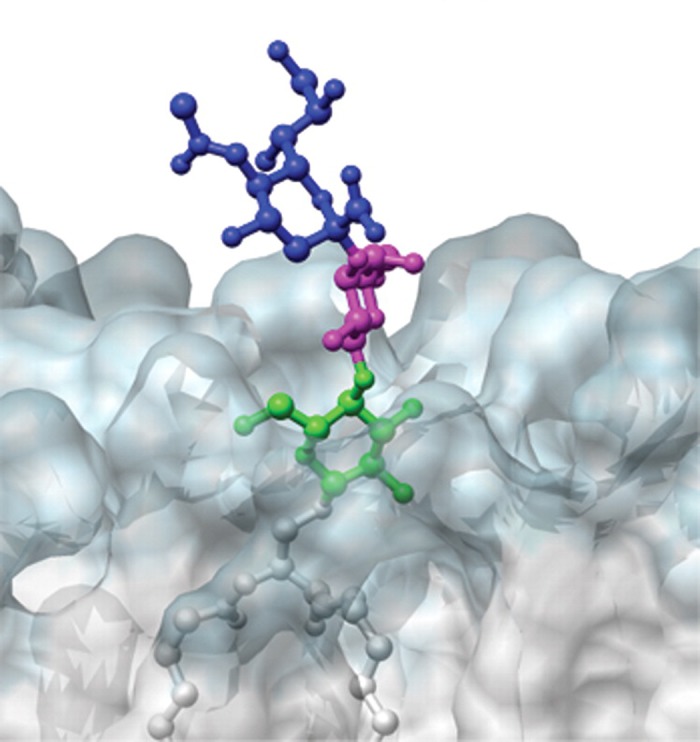
Atomic-resolution conformational analysis of ganglioside GM3 in a lipid bilayer. The image represents a 20-ns snapshot taken perpendicular to the plane of the bilayer near the head group of GM3. The ganglioside is shown as a ball-and-stick model and the membrane as a transparent space-filling model with the membrane hydrophilic region in blue and membrane hydrophobic region in white. [From DeMarco and Woods (110), by permission from Oxford University Press.]