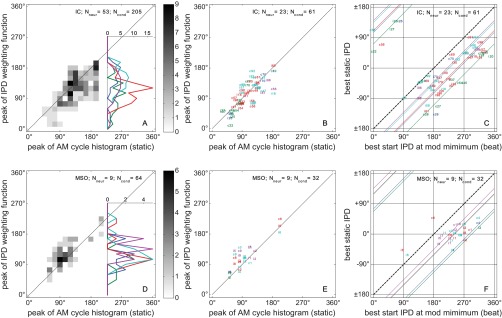
Fig. 7.

Summarizing data. A–C: IC data; D–F: MSO data. A and D: maximum IPD-weighting position (peak of the IPD-weighting function in Figs. 3, H and J–6, H and J) against the peak position of the static AM cycle histograms (Figs. 3E–6E). The vertical histogram insets contain a summation over the peak position of the static AM cycle histograms, leaving the maximum IPD-weighting positions as the only parameter of interest. They are separated by modulation frequency (color-coded as in Figs. 3–6). B and E: same as A and D but now with more restrictive criteria 1 + 2 [width (σ) < 60°], showing, therefore, fewer conditions (Ncond). This restriction was applied only to allow for the labeling of individual data points: modulation frequency is color-coded as in Figs. 3–6; the number identifies the neuron (Nneur), and letters “i” and “c” indicate the beat direction (i for fcontra < fipsi; c for fcontra > fipsi). C and F: peak of the AMBB-tuning curves (Figs. 3, G and K–6, G and K) against the peak of the static IPD-tuning curve of the corresponding condition (Figs. 3I–6I). The labels of the data points and the threshold criteria were identical to B and E. The format is analogous to that of the psychoacoustic data (Dietz et al. 2013b) (Fig. 3) to demonstrate the similarity between the psychophysical and physiological findings. The bold, dashed, diagonal lines indicate an offset of 180° between the static IPD and AMBB-tuning curves. This characterizes a hypothetical dominance of the IPD at the energy maximum. The colored, diagonal lines have an offset according to the across-neuron average of the maximum IPD-weighting position/modulation frequency (color codes as in previous figures). Data from the IC example neurons in Figs. 3 and 4 can be found in B and C marked “47” and “98,” and data from the MSO examples in Figs. 5 and 6 can be found in E and F marked “1” and “8”. Note that static IPDs are defined with respect to the beat direction (i.e., sign inverted when fcontra < fipsi). Therefore, data from the same neuron are plotted at 2 different best static IPD values (if both fulfill the criteria). For instance, IC neuron #81 (C: best IPD 88° contralateral leading) is either plotted at a best IPD of +88° (c81) or at −88° (i81).
