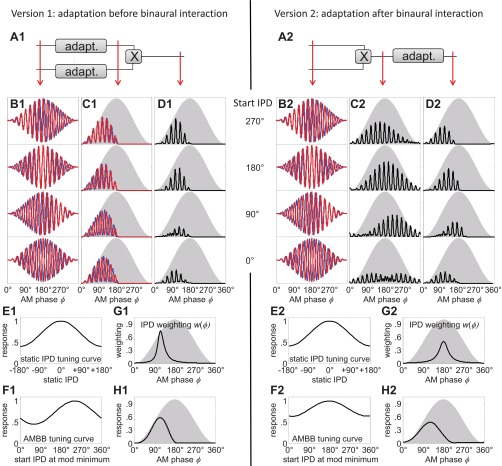
Fig. 8.
Comparison of 2 processing schemes with an auditory model. Left: prebinaural adaptation (adapt.); right: postbinaural adaptation. Note that the processing stages do not refer to specific brain nuclei. Prebinaural can be, for example, in the auditory nerve, the cochlear nucleus, or the synaptic transmission at the MSO neurons. Postbinaural means the MSO output. A1 and A2: the 2 processing schemes. B1 and B2: 4 AMBB input stimuli with different start IPDs (blue represents the left and red the right ear's signal). C1 and C2: AM cycle histograms at an intermediate processing stage (C1: after peripheral processing and adaptation but before binaural interaction; C2: after peripheral and binaural processing but before adaptation). D1 and D2: AM cycle histograms at the model output (corresponding to the data presented in Figs. 3C–6C). E1 and E2: normalized static IPD-tuning curve of the model (corresponding to the data presented in Figs. 3I–6I). The model does not include an internal, interaural delay compensation, so its best IPD is 0. F1 and F2: normalized AMBB-tuning curve as a function of start IPD (corresponding to the data presented in Figs. 3K–6K). G1 and G2: IPD-weighting function derived from the 2 tuning curves in E1 and E2 and F1 and F2 (corresponding to the data presented in Figs. 3J–6J). H1 and H2: average AM cycle histogram (corresponding to the data presented in Figs. 3E–6E). It can be seen that the model with prebinaural adaptation has its highest response with start IPD = 270° (D1, top), whereas the postbinaural adaptation model has its maximum response with start IPD = 180° (D2, 2nd from top). This results in different IPD-weighting function with rising-slope dominance only observed with prebinaural adaptation (left), whereas the average AM cycle histograms of both models are very similar with peaks at 90°.

