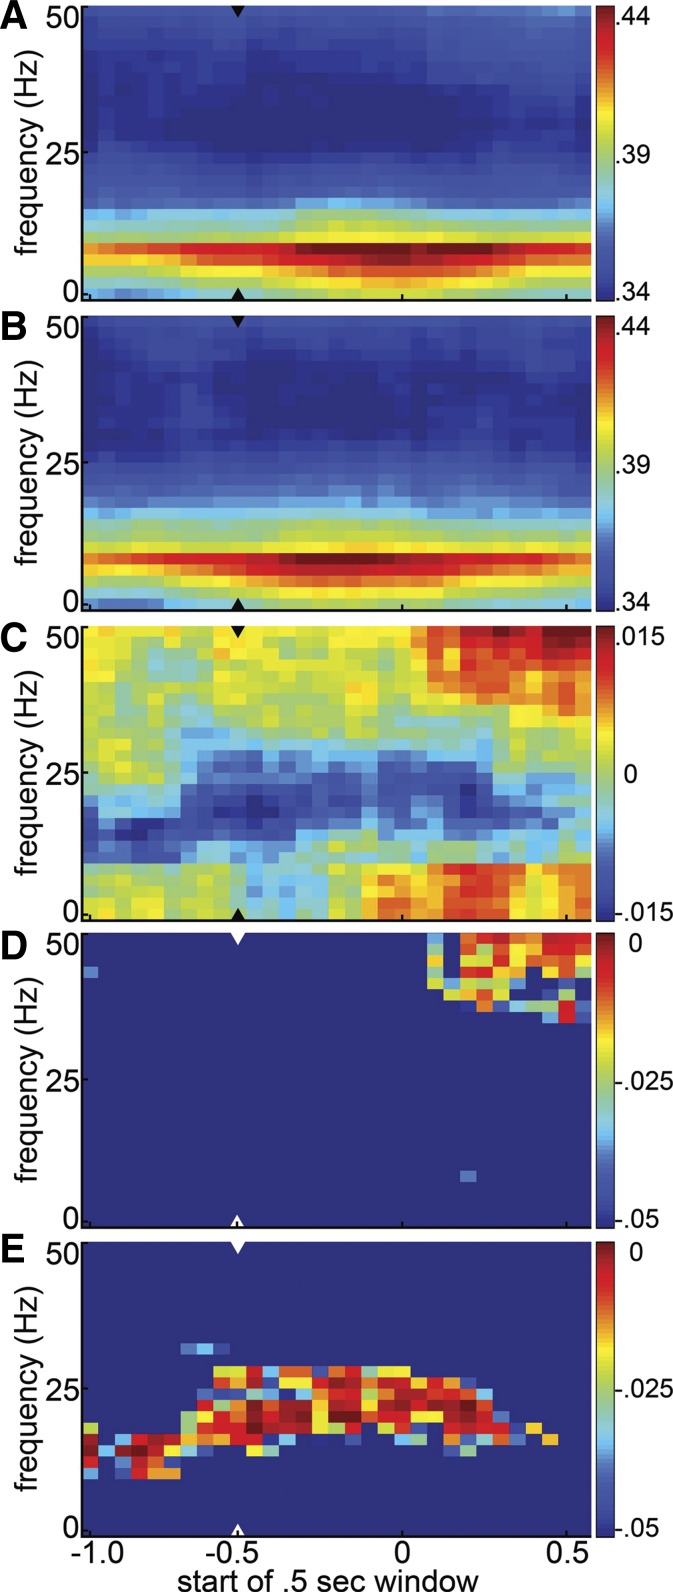
Fig. 2.
Session-averaged evolution of frontal-parietal coherence on hit vs. miss trials. A and B: average coheregrams for hit (A) and miss (B) trials. Coherence spectra were calculated in 500-ms windows shifted in 50-ms steps, averaged across interarea electrode pairs and then across hit and miss trials separately. The hit and miss coheregrams from each session were then averaged (n = 25) to form the grand coheregrams shown. As the x-axis denotes the start of each half-second window, the last prestimulus window is at −0.5, marked by the arrowheads. C: hit-miss difference coheregram: the difference between the hit and miss coheregrams shown in A and B. D and E: statistical significance and sign of differences between the average hit and miss coheregrams is shown as the P value of a 1-tailed t-test asking whether hit coherence was significantly greater than miss coherence (D) or whether miss coherence was greater than hit coherence (E). Hotter colors indicate greater statistical significance (i.e., smaller P values). In each panel the arrowhead denotes the last prestimulus window.

