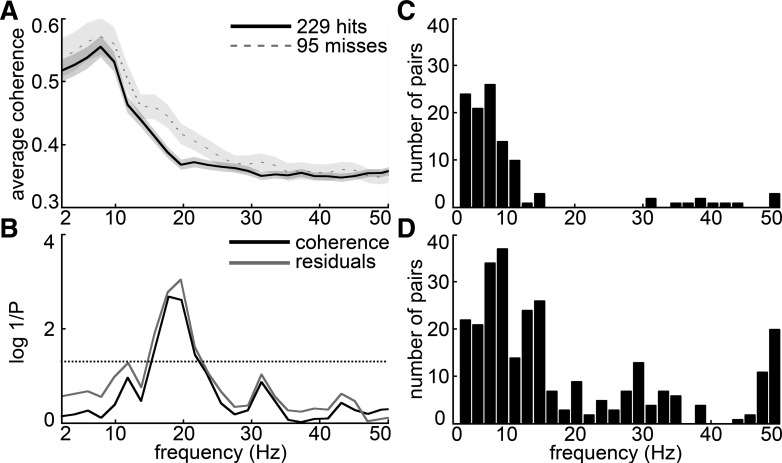
Fig. 4.
Prestimulus hit and miss coherence spectra for an example session and individual electrode pair analysis. A: the average coherence spectrum across all frontal-parietal electrode pairs for 1 detection session is plotted for hits and misses. Shading denotes SE based on the variability across trials. B: the P value for a 2-tailed unpaired t-test comparing hit and miss coherences (after tanh transformation, see materials and methods) is plotted as log(1/P) (darker curve) so that higher plotted values indicate more significant (smaller) P values. To account for potential changes in coherence associated with slow changes in rats' motivation, the lighter curve shows the analogous P values for a hit-miss comparison based on residuals of a linear regression on coherence values during each session (i.e., after slow changes have been subtracted out). Frequency bins where either curve exceeds the dotted line were significant at the 95% confidence level; similarly, bins where the curve exceeds 2 on the y-axis were significant at the 99% confidence level [since log(1/0.01) = 2]. C and D: total number (across 25 sessions) of individual frontal-parietal electrode pairs at each frequency bin that showed prestimulus hit coherence significantly greater than miss coherence (C) or vice versa (D), according to a stringent Bonferroni-corrected criterion (t-test, uncorrected α = 0.05).

