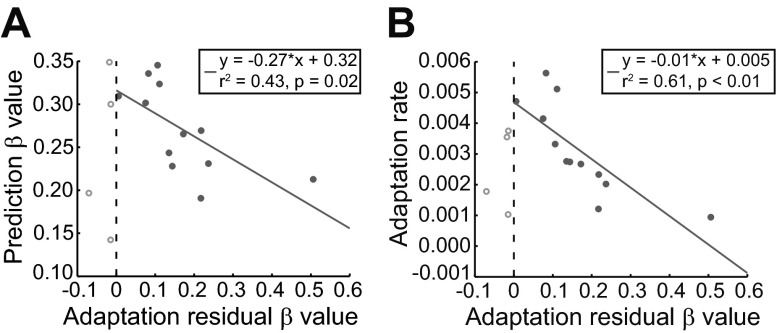
Fig. 5.
Fluctuations of adaptation residuals also describe learning. A: relationship between β measured for the predictive-saccade task and the adaptation residual β value (βres). In general, β and βres are inversely correlated, particularly when values of βres are positive. B: relationship between adaptation rate and βres values assessed for adaptation residuals. As in A, these βres values can be divided into 2 regions. When βres > 0 (persistent fluctuations), there is a correlation with adaptation rate; this agrees with the correlation between β and βres for βres > 0. When βres < 0 (oscillatory, anticorrelated behavioral variations), we see that occasionally subjects exhibit poor learning in general (slow adaptation rates and near-zero predictive-saccade β values).

