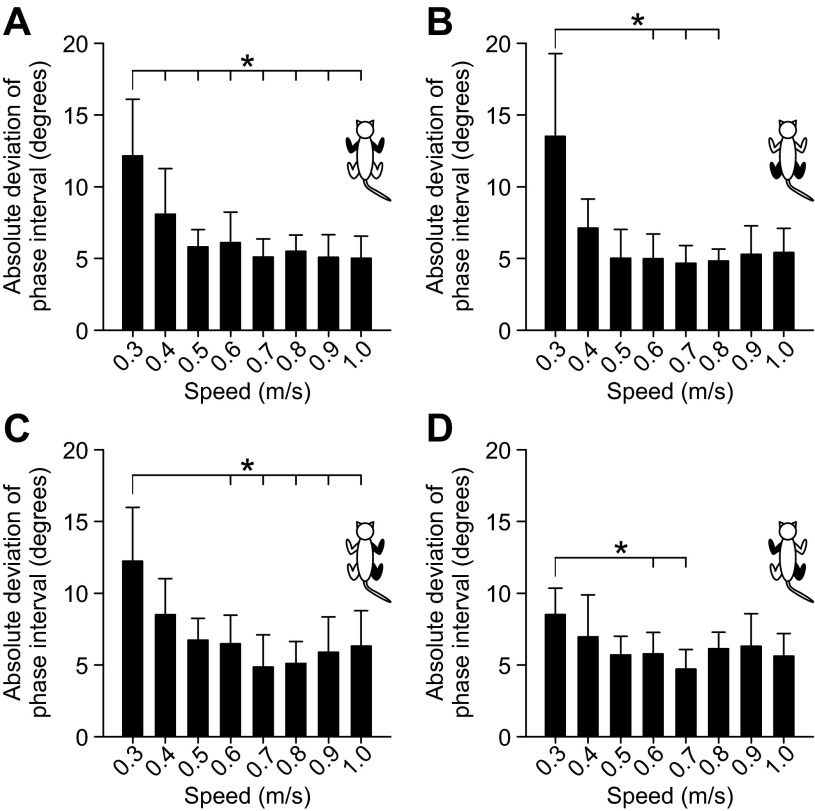
Fig. 11.
Effect of treadmill speed on the absolute deviation of phase intervals of the 4 different limb pairs across sessions/animals. The absolute deviation of phase intervals was measured by calculating the absolute difference from the mean at every speed for each cat to then calculate the group average. The averaged absolute deviation of phase intervals is shown for 4 different limb pairs: the left and right forelimbs (A), the left and right hindlimbs (B), the right forelimb and right hindlimb (C), and the left forelimb and right hindlimb (D). The limb pairs shown in each panel are shown in black in the cat diagram at top right. Each bar is the average ± SD absolute deviation of 10 sessions (5 cats × 2 sessions). Asterisks indicate significant differences (pairwise comparisons with Bonferroni correction) between speeds, with the long horizontal line indicating the start of the comparisons (i.e., from 0.3 m/s to other speeds). *P < 0.05.

