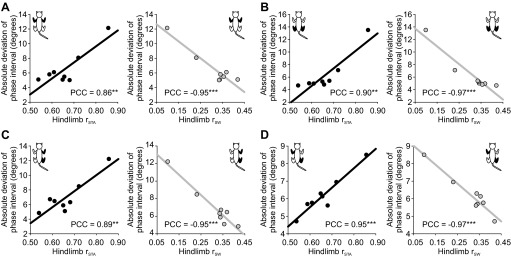
Fig. 12.

Correlation between phase variations and the consistency of interlimb coordination. A–D show linear regressions between the average absolute deviation of the phase interval for 4 different limb pairs (indicated by black limbs in cat diagram at top left or top right) and hindlimb rSTA (i.e., the slope of the linear regression between stance and cycle duration; left) or hindlimb rSW (i.e., the slope of the linear regression between swing and cycle duration; right). Pearson's correlation coefficient (PCC) is indicated on each panel. Asterisks indicate whether the correlation was significant: **P < 0.01, ***P < 0.001.
