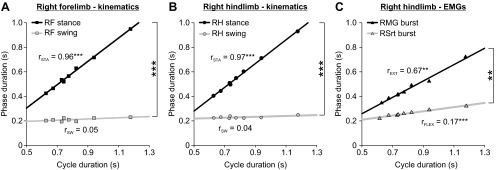
Fig. 3.

Effect of speed on the linear regressions between the phases and cycle duration within a session of 1 cat: simple linear regression analyses of phase durations as a function of cycle duration from the data shown in Fig. 2, A–C. Values of the slopes of the linear regressions between stance and cycle duration (rSTA) and between swing and cycle duration (rSW) are indicated for RF (A) and RH (B). The slopes of the linear regressions between the extensor burst duration and cycle duration (rEXT) and between the flexor burst duration and cycle duration (rFLEX) are shown in C for RH. Asterisks indicate a significant regression or significant differences between rSTA and rSW or between rEXT and rFLEX (multiple-regression analysis, P < 0.05): **P < 0.01, ***P < 0.001.
