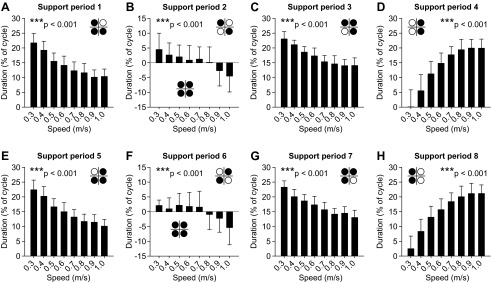
Fig. 8.

Effect of treadmill speed on the 8 support periods across sessions. A–H indicate support periods 1–8, respectively. The limbs contacting the surface during each period are shown with a footfall diagram (see Fig. 1). Note that support periods 2 (B) and 6 (F) have 2 different footfall patterns, with positive and negative values representing periods of quadruple and double support, respectively. Each vertical bar is the average of 10 sessions (5 cats × 2 sessions) expressed as % of the cycle. Every support period was significantly affected by speed: ***P < 0.001 (1-factor repeated-measures ANOVA).
