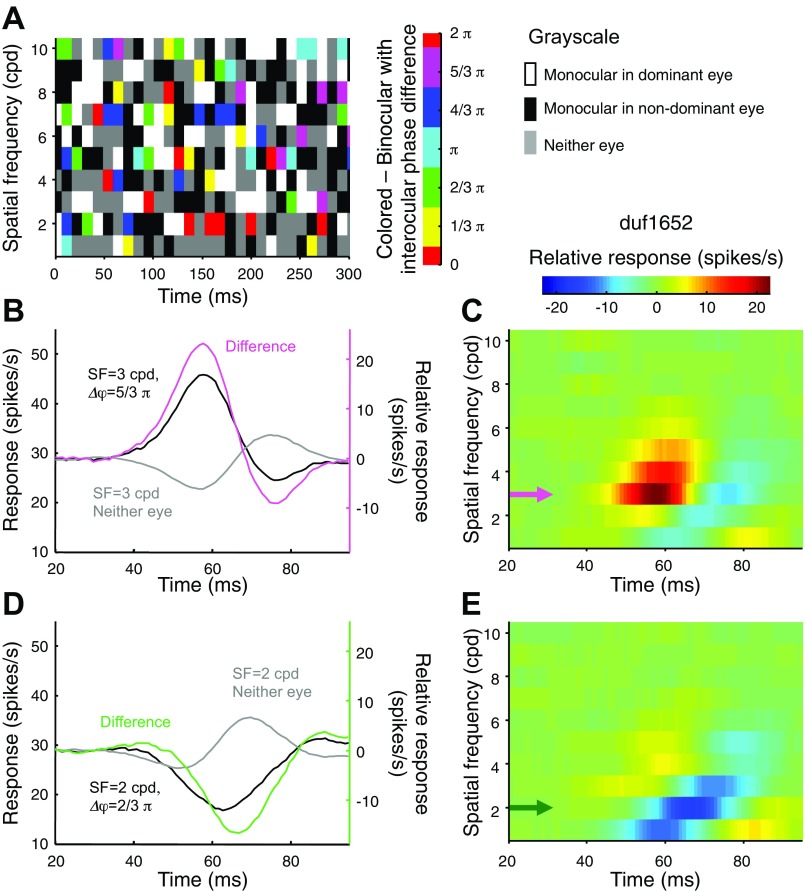
Fig. 1.
Responses of a primary visual cortex (V1) neuron to the stimulus randomized in the Fourier domain. A: color-coded matrix is a schematic illustration of the stimulus sequence. Each column represents 1 video frame. The random sequence of a spatial frequency (SF) component constitutes 1 row. The grayscale and the color codes are described at right. B: black and gray traces show the response time courses triggered by the presence of 1 SF component in both eyes [3 cycles/degree (cpd), Δφ = 5/3π] or the absence in both eyes, respectively. The gray trace serves as the baseline. The relative response is shown in magenta, with its y-axis shown at right. C: relative responses are shown for all the SF components with Δφ = 5/3π. The color code is given at top. The magenta arrow indicates the trace shown in B. D: responses are triggered by another SF component (2 cpd, Δφ = 2/3π). The relative response of this component was suppressive (green trace). E: relative responses are shown for all the SF components with Δφ = 2/3π. The green arrow indicates the trace shown in D.

