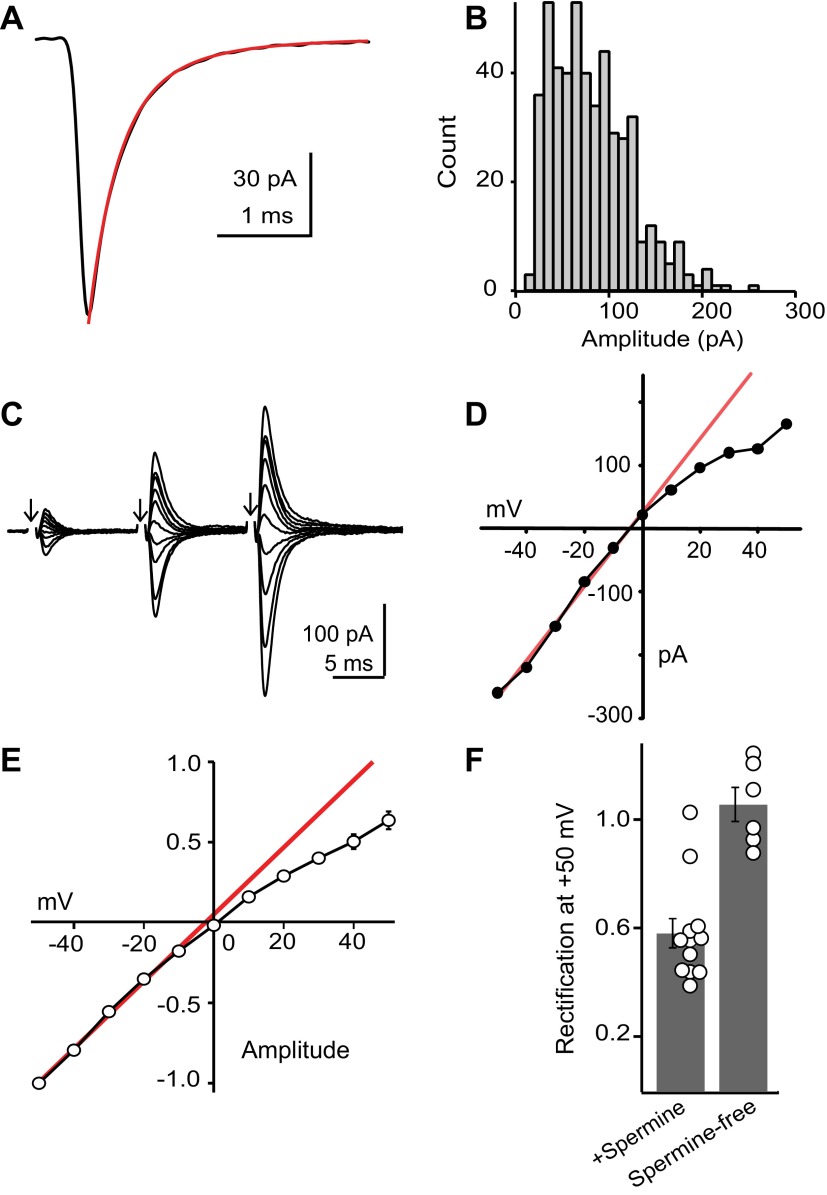
Fig. 2.
AMPA receptors are Ca2+ permeable. A: example average miniature EPSC (mEPSC) from a dorsal cochlear nucleus (DCN) stellate cell. The decay phase is fit with a double exponential decay (weighted decay τ = 0.42 ms). B: amplitude histogram of individual mEPSCs from the same cell as in A. C: example average EPSCs evoked at different holding potentials. Arrows denote time of parallel fiber stimulation. The shock artifact is blanked for clarity. D: current-voltage (I–V) curve for the third EPSC in the example traces shown in A. The red line is a linear fit to the data recorded at negative holding potentials. E: summary I–V curve for 12 cells, normalized to the amplitude at −50 mV. Error bars are generally smaller than the symbols. F: group data showing the rectification index (ratio of response recorded at +50 mV to that predicted from linear fit to points at negative potentials) of individual stellate cells. Note that all cells recorded with a spermine-free internal solution displayed a linear I–V.

