Fig. 4.
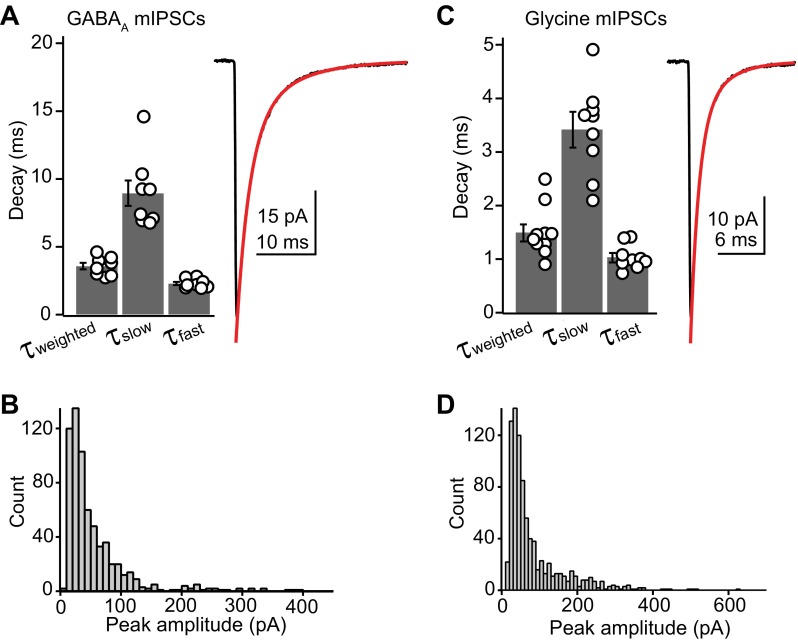
Inhibition is mediated by glycine and GABA. A, left: summary data showing the distribution of fast, slow, and weighted decay time constants for average GABAA miniature inhibitory postsynaptic currents (mIPSCs). Right, example average GABAA mIPSC. Red curve is the double exponential fit to the decay phase. Rate constants for the fit were as follows: τfast, 2.1 ms (73%); τslow, 7.1 ms (27%); τweighted, 3.41 ms. B: histogram showing the amplitude distribution of GABAA mIPSCs from a single cell. These data are from a different cell from that shown in A. C, left: summary data showing the distribution of fast, slow, and weighted decay time constants for average glycine mIPSCs. Right, example average glycine mIPSC. Red curve is the double exponential fit to the decay phase. Rate constants for the fit were as follows: τfast, 0.9 ms (75%); τslow, 3.0 ms (25%); τweighted, 1.5 ms. D: histogram showing the amplitude distribution of glycine mIPSCs from a single cell. The data are from a different cell from that shown in C.

