
Fig. 3.
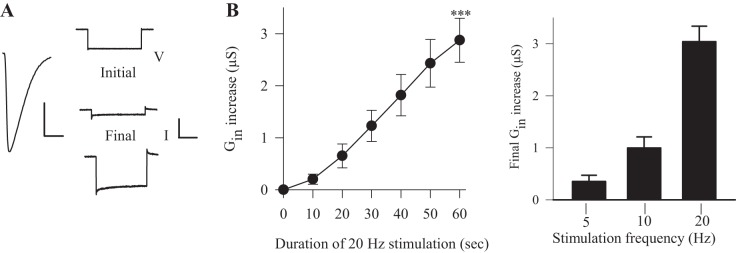
Synaptic activity produced an increase in Gin even when the muscle fiber was voltage clamped. A, left: the muscle membrane was voltage clamped, and the EPSC was observed during 20-Hz stimulation for 60 s. Right: representative traces of the membrane currents produced by a −20-mV voltage step before (Initial) and at the end of stimulation (Final). Calibration: V = 20 mV, 100 ms; I = 20 nA, 100 ms. B, left: Gin gradually increases during synaptic stimulation at 20 Hz, such that Gin at the end of stimulation was significantly greater than at the beginning (n = 8). ***P < 0.001, paired t-test. Right: the increase in Gin produced by the 60-s trains was greater as stimulation frequency was increased: 5 Hz (n = 3) and 10 Hz (n = 6). Values are means ± SE.