Fig. 4.
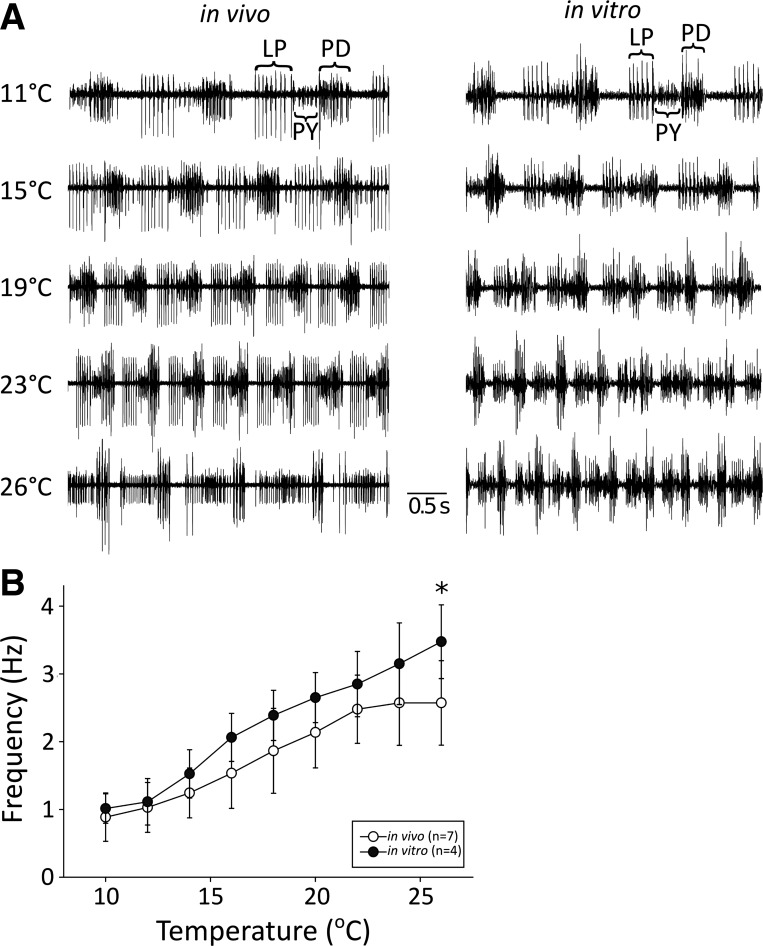
In vivo preparations exhibit slightly lower pyloric cycle frequencies than in vitro. A: sample traces of the in vivo and in vitro pyloric rhythms at 11, 15, 19, 23, and 26°C. B: average frequencies of the pyloric rhythm over a range of temperatures from 10°C to 26°C for both in vivo (n = 7) and in vitro (n = 4) preparations. Frequencies were divided into bins with widths of 2°C. Open circles indicate data from in vivo preparations, and solid circles indicate data from in vitro preparations. The x-values of the data points represent the average temperature for each bin. Bars indicate standard deviation. *Significantly different groups at a significance level of α = 0.05.

