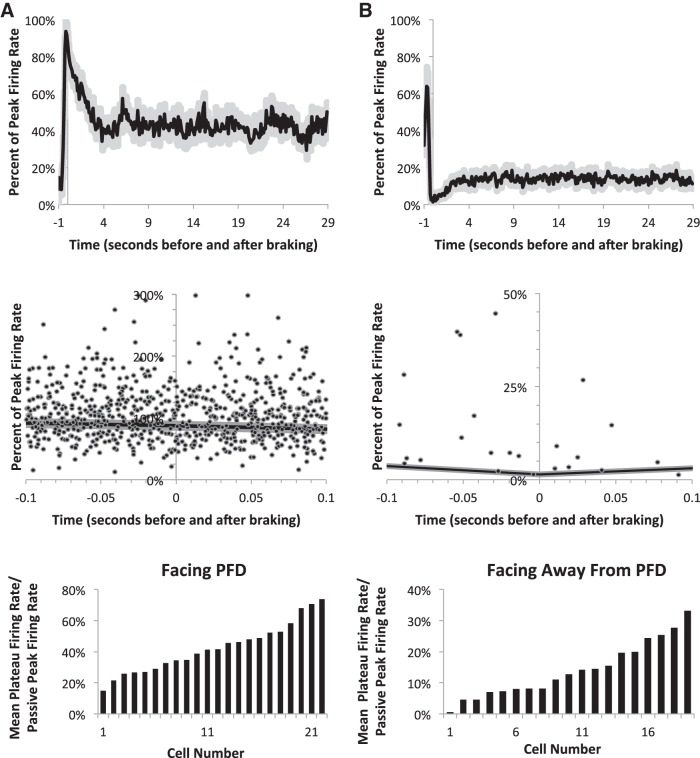
Fig. 4.
The graphs display histograms of the mean firing rates of HD cells, normalized by the cell's peak firing rate measured during passive rotation, and binned in 100-ms increments. Time zero is the point at which the animal stopped moving. Negative times represent when the animal was passively rotating back and forth, and positive times represent the period when the animal was statically facing a fixed direction. The graphs in the top row represent the average binned firing rate response from 1 s prior to 29 s after the brake. The graphs in the middle row represent the average binned firing rate and the instantaneous firing rates from 100 ms before to 100 ms after the brake. The mean of the binned firing rates is represented by the black line in the top two graphs; the standard error is shown by gray shading around the line, and individual spikes are black circles (defined by the spike time and the average of the inverse interspike interval before and after that spike, divided by the HD cell's peak firing rate). A: sessions when the animal was stopped while facing the cell's PFD (n = 22 cells). B: sessions when the animal was stopped facing 90° CCW away from the cell's PFD (n = 19, different cells than in A). Bar graphs below are population histograms showing the mean HD cell responses during the steady state period (4–29 s) contributing to the graphs above. The population histograms display each HD cell's mean steady-state firing rate as a percentage of the cell's peak firing rate measured during passive rotation.

