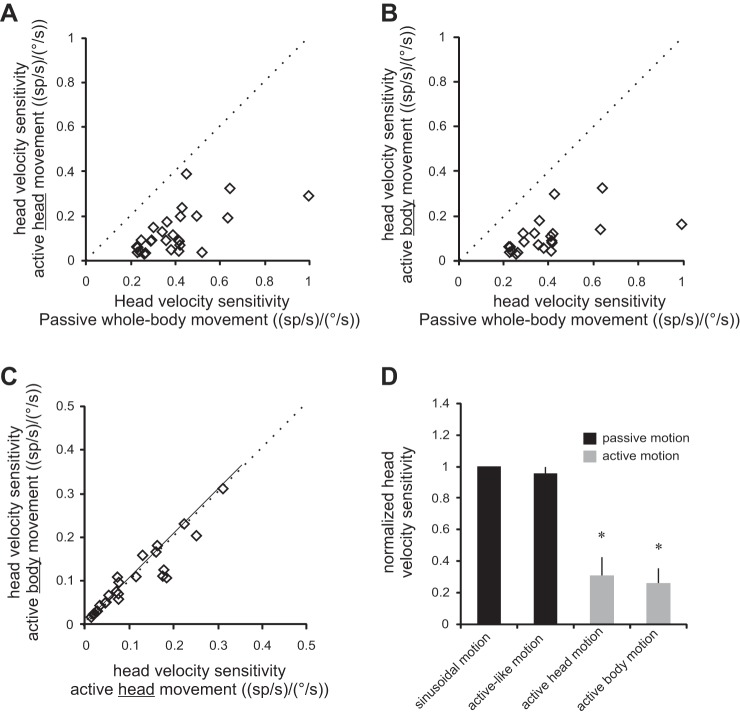
Fig. 3.
Summary of neuronal sensitivities to active body motion. A and B: cell-by-cell comparison of neuronal sensitivities to active motion of the head (A) and head together with body (B) vs. passively applied head motion. Note that neuronal sensitivities to vestibular stimulation were reduced during active motion, regardless of whether it was generated by the neck (A) or axial (B) musculature. C: comparison of neuronal vestibular sensitivities to active motion produced by motion of the head vs. body. Dotted lines represent the unity line, and solid lines represent regression lines. D: histogram comparing sensitivities to passively applied motion and actively generated motion across conditions. *Significant difference (P < 0.001).

