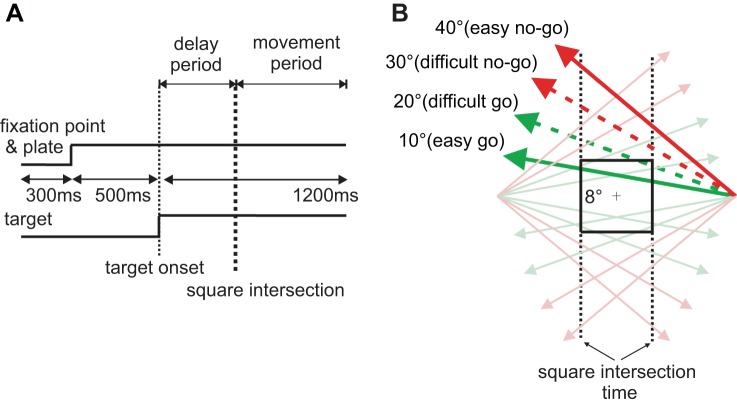
Fig. 1.
Experimental design. A: temporal schematic for the go/nogo ocular decision task. B: target trajectories in relation to the visible square. The locations where target trajectories intersect the vertical, dashed lines indicate square intersection time. Go trials (green lines) intersect the square, and nogo trials (red lines) miss the square.

