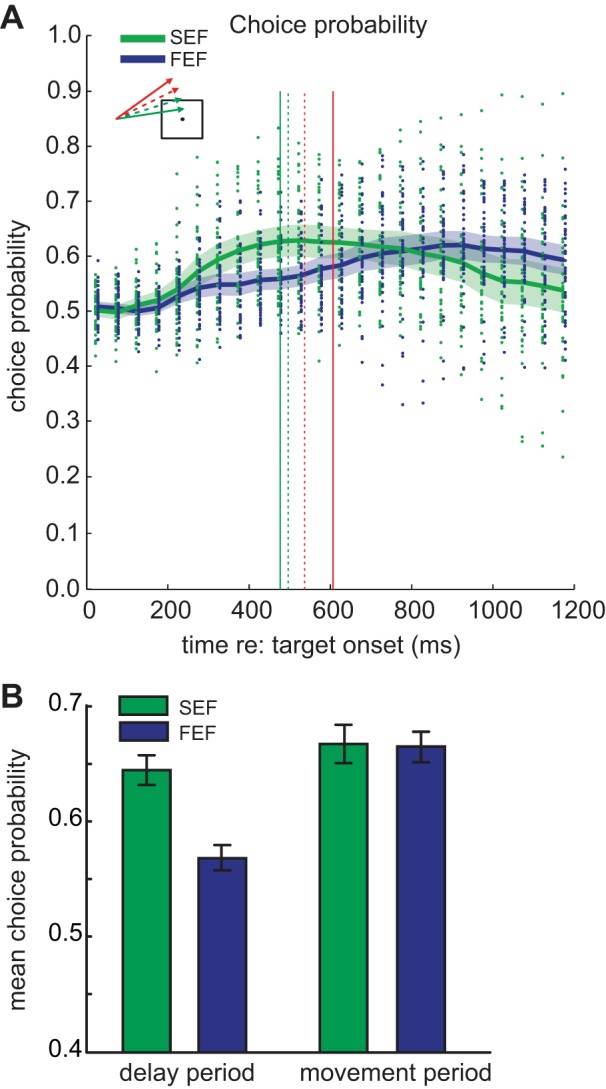
Fig. 10.

Choice probability for SEF (green) and FEF (blue) neurons across the duration of the ocular go/nogo trial. A: choice probability for all SEF and FEF neurons at different times in ocular go/nogo trials. Each dot represents the choice probability value of an individual neuron for combined easy and difficult trials. The curves represent the mean choice probability over time-based 50-ms intervals and the corresponding shaded area the 95% confidence interval. Vertical lines indicate square intersection time for go/nogo trials. B: mean choice probability in the delay and movement periods. Error bars indicate 95% confidence intervals.
