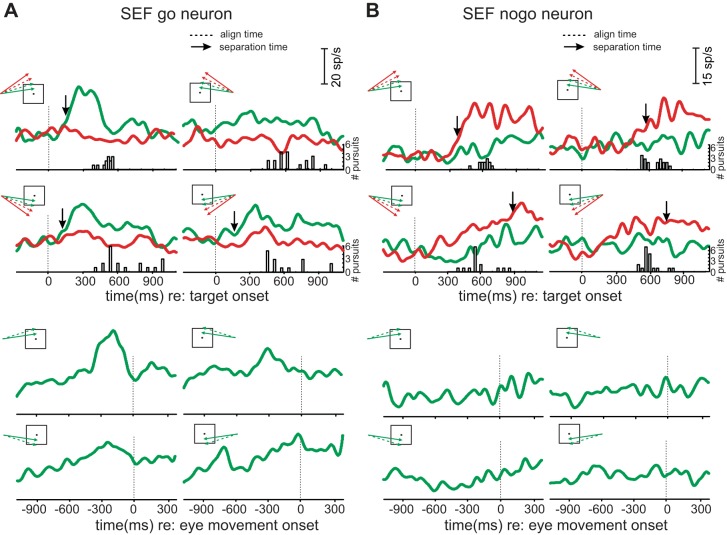
Fig. 2.
Results from example supplementary eye field (SEF) go and nogo neurons. A: SEF go neuron. Traces are grouped by alignment time (top: aligned on target motion onset; bottom: aligned on movement onset). In each subpanel within an alignment, activity in go (green curves) and nogo (red curves) trials is plotted for the 4 trajectories shown in the inset, averaged over the 2 go and the 2 nogo trajectories, respectively. Vertical, dashed lines show alignment events. Vertical arrows show separation times for recorded activity. Traces without arrows did not separate before movement onset. The frequency distribution below the traces shows when eye movements were initiated during success trials. B: SEF nogo neuron. Note that activity in nogo trials is higher than on go trials for all directions. sp/s, Spikes per second; #, number of.

