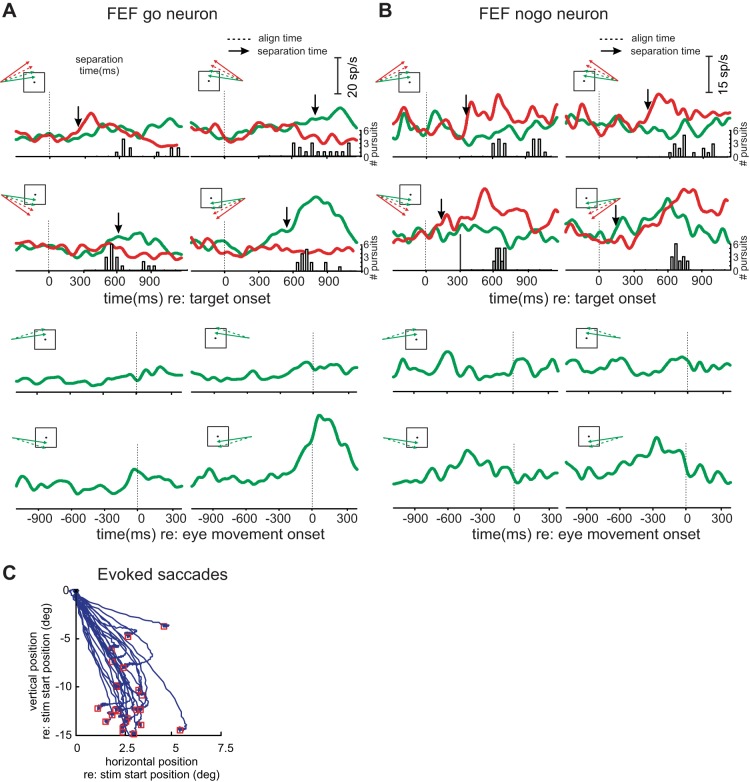
Fig. 3.
Results from example frontal eye field (FEF) go and nogo neurons. A: example FEF go neuron. Illustrated as in Fig. 2. In contrast with the SEF example neuron (Fig. 2), activity on go trials peaks slightly after movement onset and has relatively narrow tuning. B: example FEF nogo neuron. Higher activity during nogo than go trials is evident, but no consistent peak or directional selectivity is evident. C: evoked saccades from the site where the example go neuron was recorded. Saccades are plotted in Cartesian coordinates with 0,0 point corresponding to saccade origin and red squares depicting saccade endpoints. stim, Stimulation; deg, degrees.

