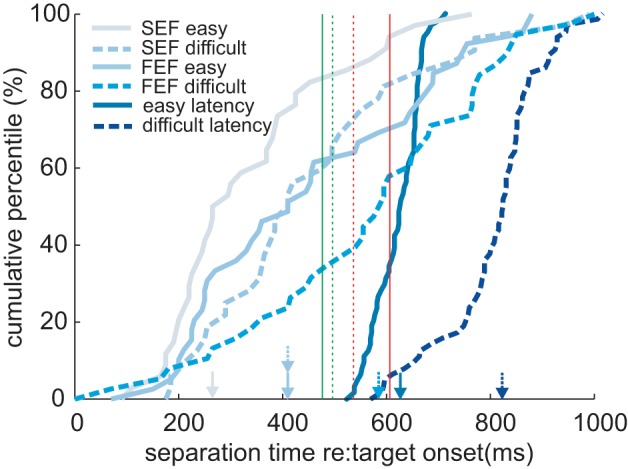
Fig. 4.

Cumulative distributions for the separation time between spike density curves in go and nogo trials as well as average pursuit latency for go trials. Results from easy (solid curves) and difficult (dashed curves) trials are plotted separately for all SEF and FEF go and nogo neurons. The arrows above the horizontal axis indicate the median separation time and pursuit latency (50% of neurons) for the corresponding curves. Vertical lines indicate square intersection times for easy (solid) and difficult (dashed) and go (green) and nogo (red) trials, respectively.
