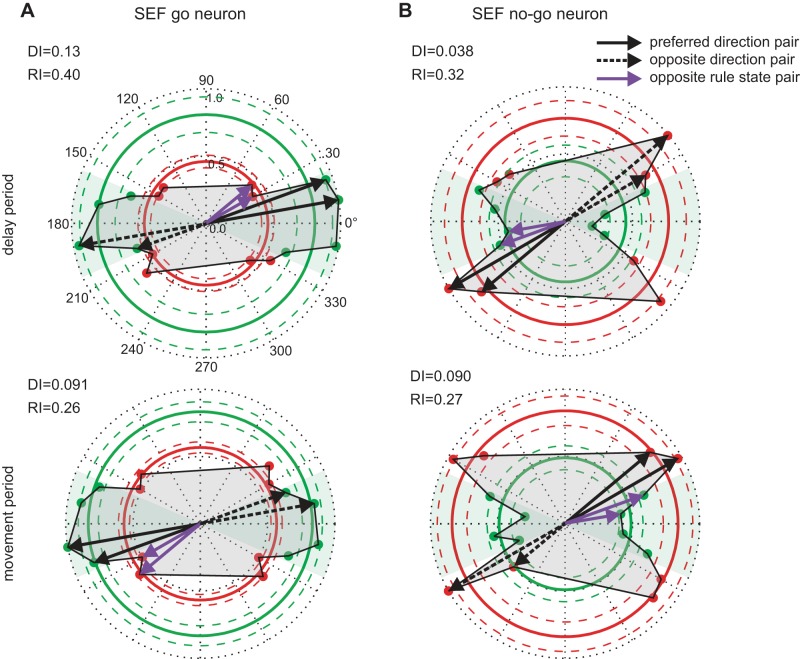
Fig. 5.
Directional and rule tuning of example SEF neurons in the delay and movement periods. A: results from an example SEF go neuron (top: delay period; bottom: movement period). The length of the radiating lines indicates the normalized mean spike rate for corresponding trajectories in relation to the 1 with the highest spike rate. The arrows indicate the direction of motion (rightward: 0°; leftward: 180°). The green shaded area encompasses the go rule state; gray shading demarcates the tuning function. Thick circles indicate the normalized mean spike rate (center: 0; border: 1) for all trajectories with the same decision criteria within a rule state (go rule state: green; nogo rule state: red), and the 2 corresponding thin circles represent the 95% confidence interval of spike rate. The preferred direction of the neuron was determined by the pair of trajectories with the highest mean spike rate with the additional criterion that both trajectories lie within the same rule state (solid black arrows). The activity for the pair of trajectories with the opposite direction (dotted black arrows) was compared with the preferred direction to calculate directionality index (DI). For rule index (RI), the preferred direction pair was compared with the adjacent pair of trajectories that lie in the other rule state (purple arrows). These were used to compute directional and rule indices (see methods) to reflect the degree of neural activity in encoding target direction and decision rule. B: results from an example SEF nogo neuron.

