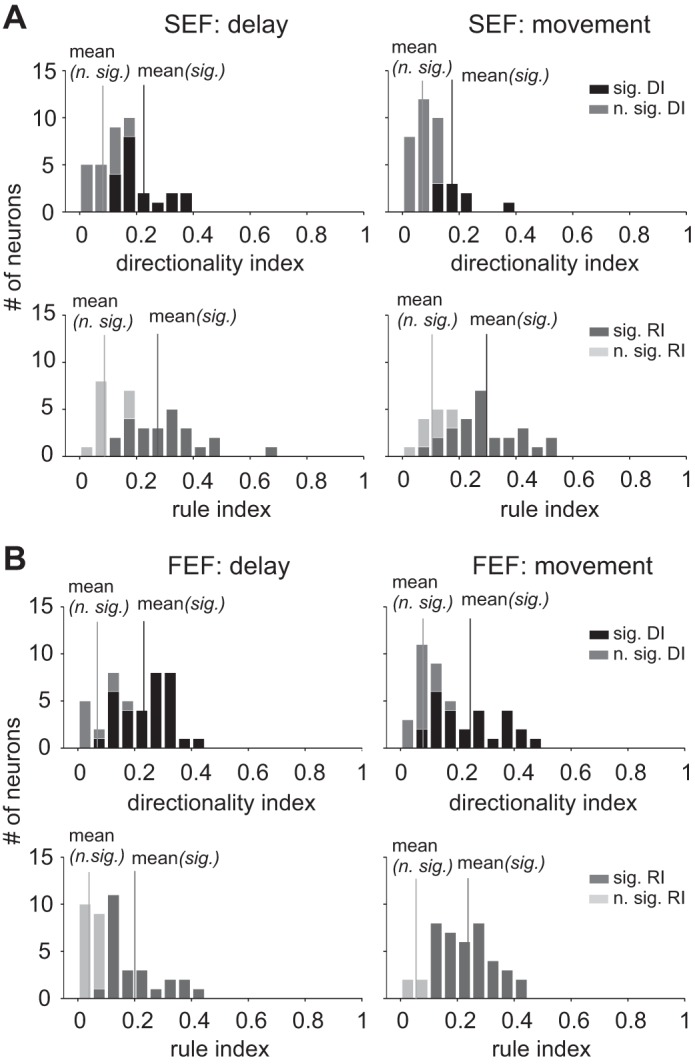
Fig. 8.

Histograms of DI and RI for all SEF and FEF neurons in the delay and movement periods of the ocular go/nogo trial. A: DI (upper panels) and RI (lower panels) values for SEF neurons in the delay (left panels) and movement (right panels) periods. Here, easy and difficulty trials were combined to calculate DI and RI. Dark bars indicate significant DI and RI (different from 0) and light bars insignificant (n. sig.). The vertical lines indicate the mean DI and RI values for all significant and nonsignificant neurons. B: results for FEF neurons.
