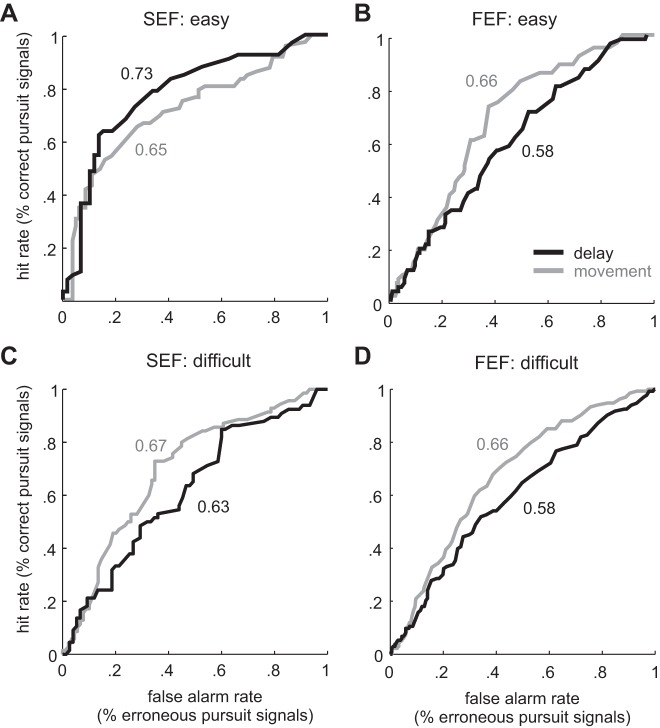
Fig. 9.
Receiver operating characteristic (ROC) curves for example SEF and FEF neurons based on their mean spike rate in relation to the ocular decision. A: ROC curves for an SEF neuron in easy trials. The x-axis represents the rate of false alarm (target pursuit in nogo trials) and the y-axis the rate of correct hit (target pursuit in go trials). The dark curve indicates the ROC for neural activity in the delay period and the light curve the movement period. Numbers shown in the figure indicate the area before the curve (e.g., choice probability) for this neuron for the delay and movement periods, respectively. B: ROC curves for an FEF neuron in easy trials. C: ROC curves for the same SEF neuron in difficult trials. D: ROC curves for the same FEF neuron in difficult trials.

