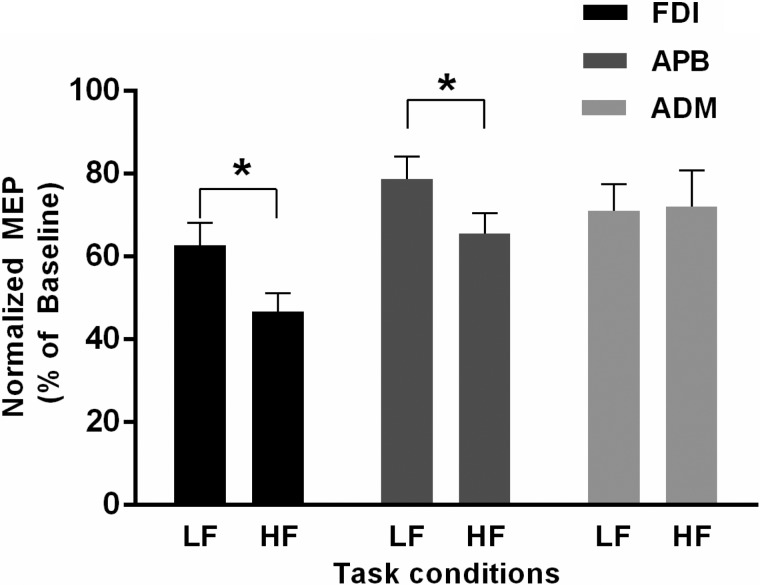
Fig. 4.
MEP data pooled across experiments 1 and 2b. Normalized MEP data obtained through single-pulse TMS pooled across experiments 1 and 2b (n = 18) are shown for the FDI, APB, and ADM muscles at the time of go cue for HF and LF tasks. Data are averages of all subjects (vertical bars denote SE). *P < 0.001, significant differences in MEP between HF and LF tasks.

