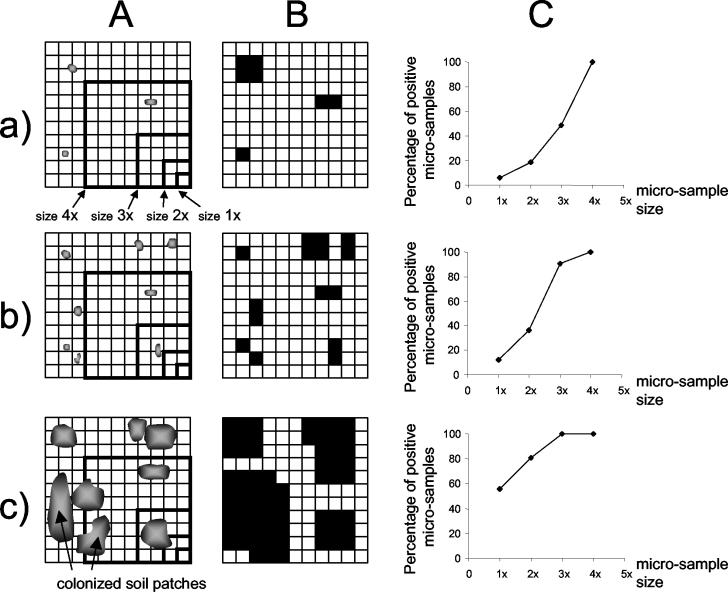
FIG. 1.
Principles of the spatial analysis. (A) Distribution of soil patches colonized by bacteria in a two-dimensional grid with an indication of the four sizes of microsamples used. (B) Same distribution after the test for the presence of bacteria. The black and white elementary units represent positive and negative results, respectively. (C) Corresponding curves obtained after sampling, showing the percentages of positive microsamples as a function of the four microsample sizes. Different types of distribution of bacteria are shown in rows a, b, and c.

