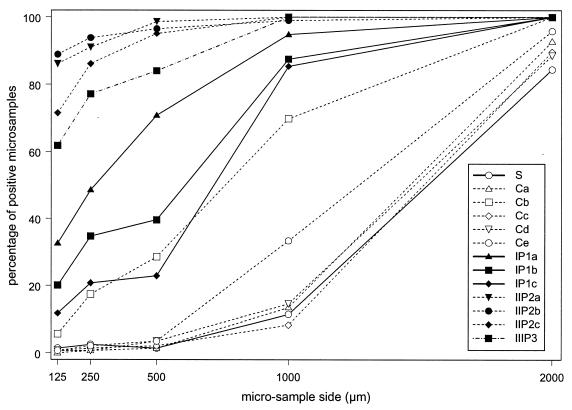
FIG. 2.
Experimental results of the spatial analysis: percentages of microsamples that were positive for the presence of 2,4-D degraders as a function of microsample size for the different column treatments. S, original soil; C, soils from control columns; IP1, IIP2, and IIIP3, soils after one, two, and three pulses of 2,4-D, respectively. The suffixes a, b, c, d, and e indicate replicates of the same treatment.

