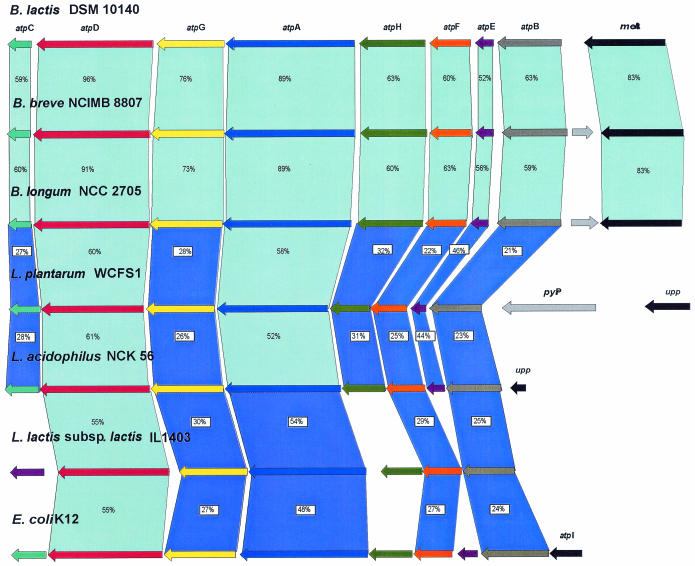
FIG. 1.
Comparison of the atp operon of B. lactis DSM 10140 with the corresponding operons of different bacteria. The putative function of the protein is indicated above each arrow. Related proteins are linked by light blue shading (≥52%) and dark blue shading (≤51%) according to the different levels of amino acid similarity; the levels of amino acid identity (expressed as percentages) are indicated. The length of each arrow is proportional to the length of the predicted ORF. Corresponding genes are indicated by arrows that are the same color.

