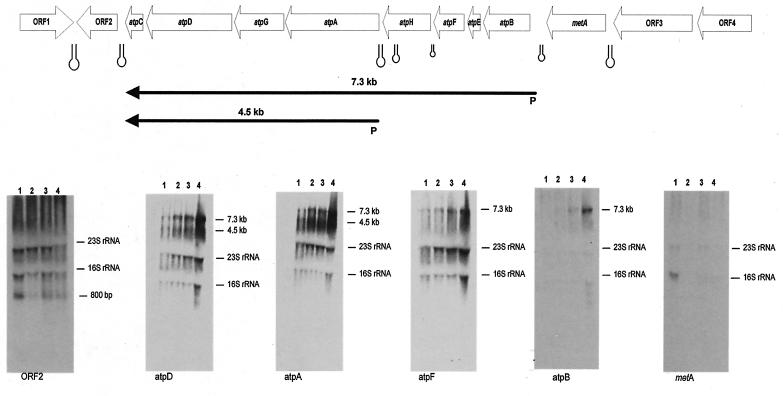
FIG. 2.
Northern hybridization analysis of B. lactis RNA and transcription unit mapping of the atp operon. All predicted ORFs are indicated and are annotated with their database matches. The transcripts are indicated by arrows, and the arrows point toward the 3′ end of the mRNA. The estimated size of the mRNA is indicated. Hairpins indicate possible rho-independent terminators. The transcripts are positioned with respect to the genome map shown at the top. The gels show the results of Northern blot hybridization of RNA isolated from B. lactis DSM 10140 upon exposure to low pH at 100 min. Lane 1, RNA isolated from a culture after exposure to pH 6.0; lane 2, RNA isolated from a culture after exposure to pH 5.5; lane 3, RNA isolated from a culture after exposure to pH 4.0; lane 4, RNA isolated from a culture after exposure to pH 3.5. Hybridization was performed by using the probes corresponding to the ORFs shown in the gene map at the top. The molecular size calculated for the hybridization signal is indicated next to each autoradiograph.

