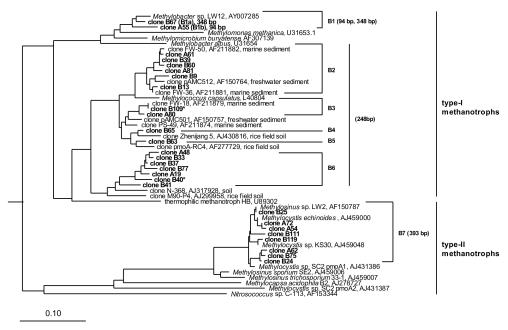
FIG. 1.
Phylogenetic tree based on deduced PmoA amino acid sequences, showing the positions of pmoA clones obtained in this study relative to cultured methanotrophs and pmoA clones of other studies. Clones are grouped into seven groups (B1 to B7) based on at least 90% nucleotide sequence identity. GenBank accession numbers are shown for sequences of cultured methanotrophs and clones of other studies. Numbers next to the clone groups represent the length of the respective T-RFs. Clones marked with an asterisk did not contain a restriction site. The bar indicates 10% sequence divergence. AmoA sequences of Nitrosomonas europaea, Nitrosomonas cryotolerans, and Nitrosospira multiformis were used as an outgroup.

