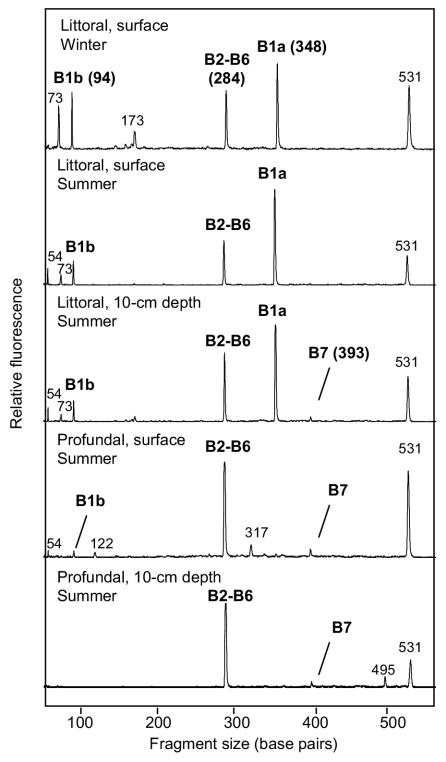
FIG. 2.
Comparison of different pmoA-based T-RFLP profiles obtained from littoral sediment cores sampled in winter and from littoral and profundal sediment cores sampled in summer at the sediment surface (0 to 1 cm) and at a 10-cm depth. Identified peaks are marked with the represented clone group. The peak at 531 bp represents the undigested pmoA fragment.

