Figure 7.
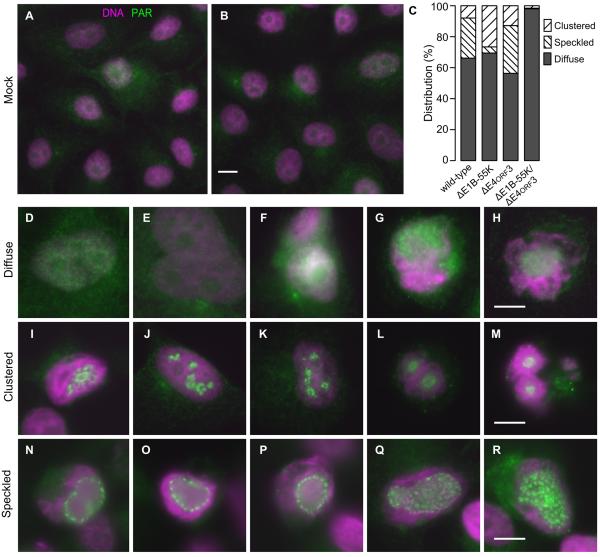
The E1B-55K and E4orf3 proteins alter the distribution of PAR or PAR-modified proteins. HeLa cells were mock-infected or infected with the wild-type, single-mutant, or double-mutant viruses and stained for PAR and DNA at 72 hpi. PAR is represented by green and DNA by magenta. (A,B) Representative low-magnification fields of mock-infected cells show faint, diffuse PAR staining throughout the cell. The scale bar indicates 10 μm. (C) Three patterns of PAR-staining were identified in virus-infected cells. The relative frequency of the three patterns of PAR localization are tabulated for approximately 300 cells for each viral infection from one of three representative experiments. (D-H, Diffuse) Representative cells showing a diffusely distributed pattern of PAR staining through cytoplasm and nucleus. (I-M, Clustered) Representative cells displaying focal concentrations of PAR staining within a small portion of the nucleus. (N-R, Speckled) Representative cells showing a more widely distributed pattern of PAR-stained foci throughout a larger portion of the nucleus. The scale bar indicates 10 μm.

