Figure 8.
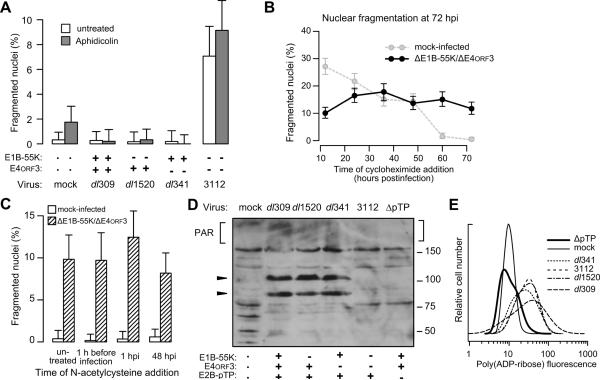
Adenoviral genome replication triggers PARP-1 activation. HeLa cells infected at an MOI of 10 with the indicated viruses were treated with (A) a concentration of aphidicolin (0.08 μM) at the time of infection sufficient to inhibit cellular DNA replication but not viral DNA replication, (B) 100 μg per ml of the protein synthesis inhibitor cycloheximide at the indicated times post-infection, or (C) the broad spectrum antioxidant and free radical scavenger N-acetylcysteine (20 mM) at various times before or after infection. Cells were stained for DNA and the fraction of cells with fragmented nuclei was determined at 72 hpi. Results from representative experiments of at least three independent experiments are shown. Error bars indicate the 95% exact binomial confidence interval for the representative experiment. (D) HeLa cells were infected with the indicated viruses, including an adenovirus mutant unable to direct viral DNA replication (ΔpTP). Protein lysates were collected at 72 hpi in the presence of protease and phosphatase inhibitors and material from identical numbers of cells analyzed by immunoblotting for PAR-ribosylated cellular proteins indicated by square brackets. The approximate migration of protein standards (in kDa) is shown on the right. Arrowheads on the left indicate the position of the hexon (upper) and penton base (lower) adenovirus capsid proteins determined by separately stained blots. (E) HeLa cells were infected with the indicated viruses, including the ΔpTP virus. The cells were fixed and stained by indirect immunofluorescence for PAR at 72 hpi. The fluorescence intensity of 300 to 1500 cells for each infection was determined by quantitative microscopy as described in the Materials and Methods. Results from a representative experiment of three are shown.

