
Figure 3. Interactive segmentation of a stented lumen and the thrombus from a postoperative computed tomography angiography (CTA) scan from a patient with an abdominal aortic aneurysm (AAA).
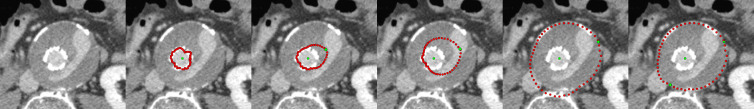
The leftmost image shows the original scan and the second image from the left presents the segmentation of the stented lumen (red) with the initial user-defined seed point (green) that has been placed inside the lumen (note: for the interactive segmentation a circle was used as template to construct the graph). The following three images show how the user places a second seed point and interactively drags it to the contour of the thrombus. However, the graph is still constructed from the initial seed point that has been placed inside the lumen. In addition, the second seed point forces the algorithm to perform the min-cut at its position and therefore also influences the positions of the min-cut in the neighboring rays. During the interactive dragging of the second seed point inside the thrombus (image three and image four from the left), the algorithm tries to adapt to other structures visible in the thrombus. In this example, contrast enhanced blood from an endoleak is visible (elongated bright area inside the thrombus), and the resulting contour adapts to this endoleak in the third and the fourth image in the lower right area: once to the left contour of the endoleak (third image) and once to the right contour of the endoleak (fourth image). In the rightmost image, the segmentation outcome has been furthermore refined by an additional seed point placed on the contour of the thrombus in the lower left.