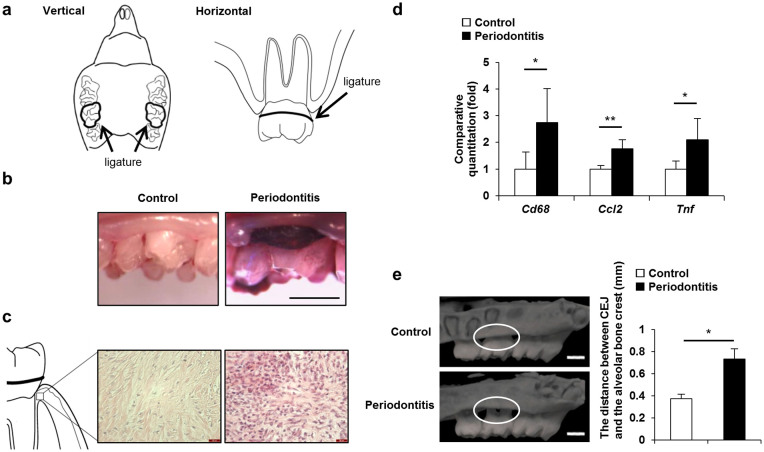
Figure 1. Induction of periodontitis.
(a) Scheme of the ligature around the cervical portion of M2 in the periodontitis rats. (b) Photographs of the cervical portion of the M2 in the control and periodontitis rats 4 weeks after ligature placement. Dental plaque was stained by Red Dye. Scale bar, 1 mm. (c) Ligature-induced periodontitis showed inflammatory cell infiltration in periodontal tissues (hematoxylin and eosin staining). Scale bar, 20 μm. (d) mRNA expression of Cd68, Ccl2 and Tnf in gingiva of the control and the periodontitis rats as determined by quantitative RT-PCR (n = 8). (e) Micro CT images of maxillae in the periodontitis and the control rats. Bone height was measured as the distance from the mesial buccal cement-enamel junction to the alveolar bone crest of the second molar (n = 8). Scale bar, 1 mm. All data represent the means ± s.e.m. *P < 0.05, **P < 0.01 in two-sided Student's t-test. All schemas were drawing by S. Miyajima.

