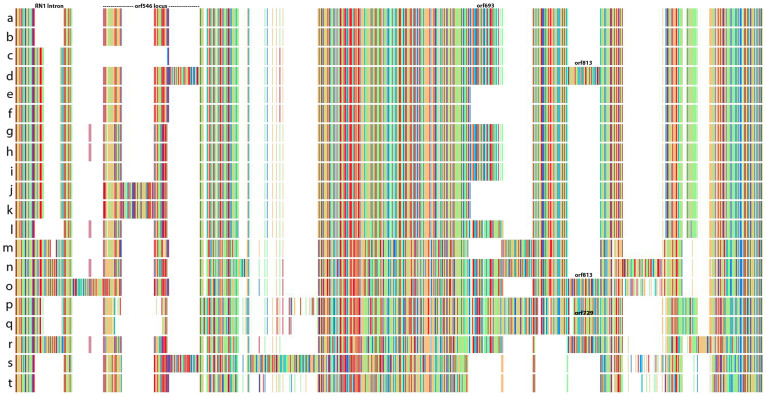
Figure 5. Linearized barcode representation of 20 aligned complete mitochondrial genomes for six species of Pyropia (a–r) and two of Porphyra (s–t).
Matching colors between rows represent similar DNA sequences, and blanks (white blocks) represent deletion events. The analysis shows that mitochondrial genomes within populations of Py. perforata are similar in content, but highly variable between populations and other Pyropia. Deletions of the two large ribosomal subunit introns (rn1 intron and orf546), a large 2,075 bp ORF (orf693), and the insertion of a 2,590 bp ORF (orf813), as well as the insertion of orf729 distinguish populations and different species of Pyropia. (a–l), Py. perforata, (a), LD-Ag 13038 (b), LD-Ag 13037 (c), UC 1450590 (d), VK-11-00061 (e), LD-Ag 13031 (f), LD-Ag 13032 (g), UC 2019900 (h), UC 2019902 (i), UC 2019901 (j), UC 95739 (k), UC 807662 (l), UC 95735 (m), VK-11-00121 (n), Py. yezoensis (o), Py. tenera (p), UC 1863890 (q), Mumford #161 (r), Py. haitanensis (s), Po. purpurea (t), Po. umbilicalis. The figure was illustrated using Jalview41.

