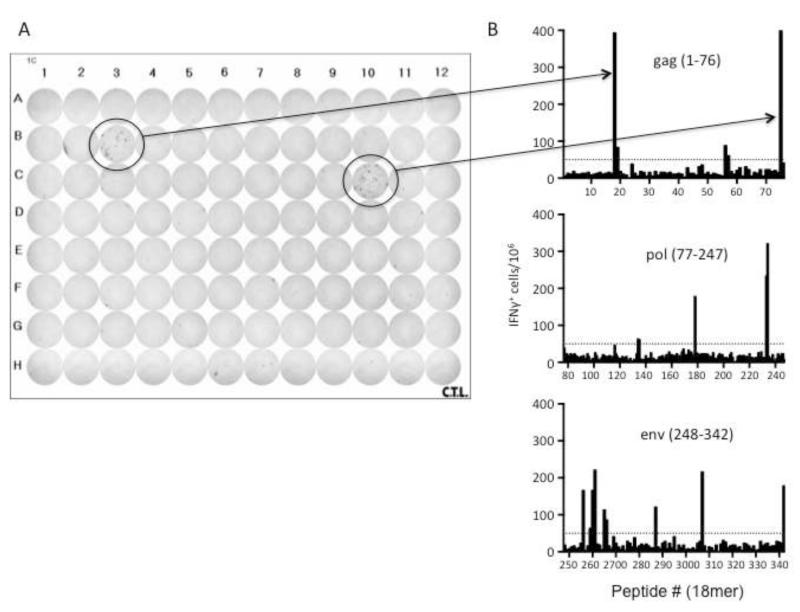
Figure 1. IFNγ ELISPOT assay.
A) A representative image of an IFN ELISPOT plate highlighting two positive wells (#18, 75) and corresponding bars in B) depicting the mean number of IFN + cells per 106 cells responding to individual 18mer peptides of the FV gag, pol and env proteins. Each bar represents the mean of two mice from one of three experiments. The dashed line denotes the cutoff of 50 IFN + cells per 106 cells.

