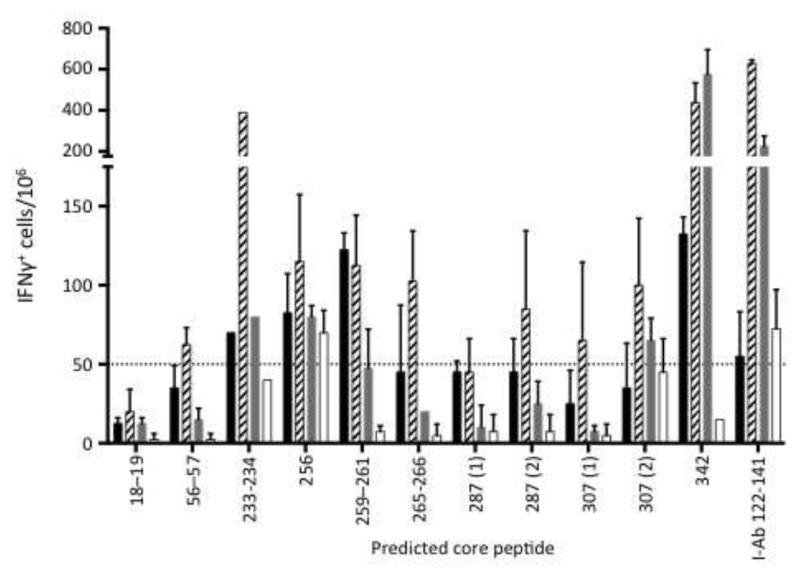
Figure 4. Reactivity against predicted core peptides.
The bar graph depicts the number of IFN +-spot forming cells per 106 spleen cells responding to the indicated core peptide from four individual mice infected with FV at 12 dpi (core sequences are shown in Table 1). The different shaded bars represent individual mice. Values represent the mean (± s.d.) of duplicate samples. The core peptides were designed using IEDB scores for predictions of binding to IAb for amino acid sequences surrounding the peptides identified in Table 1. Predictions for two of the sequences, 287 and 307, both resulted in two core peptides with very low IEDB scores so both were synthesized and tested. The I-Ab 122-141 peptide is the previously identified positive control peptide. The dashed line denotes the cutoff of 50 IFN + cells per 106 cells.

