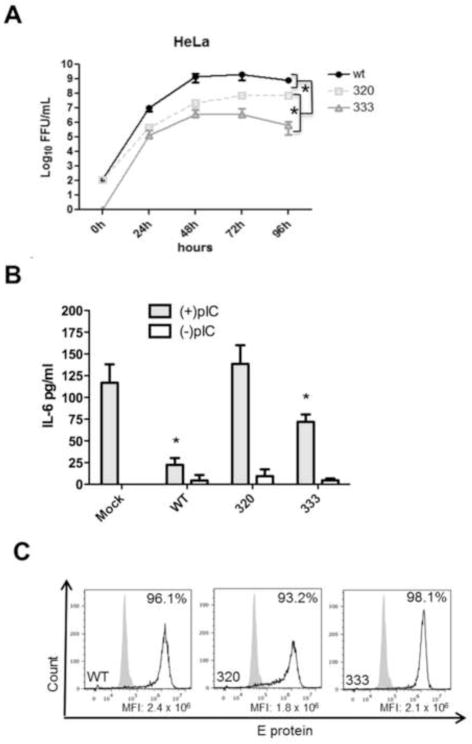
Figure 6. Replication kinetics and TLR3 inhibition of mutant WNV expressing the identified amino acid residue changes in the NS1 protein.
(A) HeLa cells were infected at an MOI of 0.01 with each WNV NS1 mutant and virus containing supernatants were collected every 24h for 96h. Infectious virus was titered on Vero cells by immunofocus assay. Growth curves were performed in biological triplicate and data are representative of two independent experiments. Error bars represent standard deviation from the mean. Statistical significance was determined by student’s t-test, where *p≤0.05. (B) HeLa cells were infected at an MOI of 5 with each WNV NS1 mutant for 1h, washed with PBS, replaced with fresh medium, and allowed to incubate for 20h. Medium was removed and replaced with medium with or without pIC (20μg/ml) for 8h. Cell culture supernatants were collected and IL-6 concentrations were determined by ELISA as pg of IL-6/ml. Data are representative of three independent experiments and error bars represent standard deviation from the mean. Statistical significance was determined by student’s t-test, where *p≤0.05 and NS= not significant. All samples were compared to mock infected cells treated with pIC. (C) HeLa cells infected with identical amounts of wt and mutant viruses were fixed and permeabilized 28h post-infection and infected cells were identified by flow cytometry using an E protein-specific primary monoclonal antibody and were detected with a secondary Alex Fluor 488 antibody. Grey filled histograms represent uninfected control cells and black open histograms represent E protein in WNV infected cell. Data are representative of three independent experiments.

