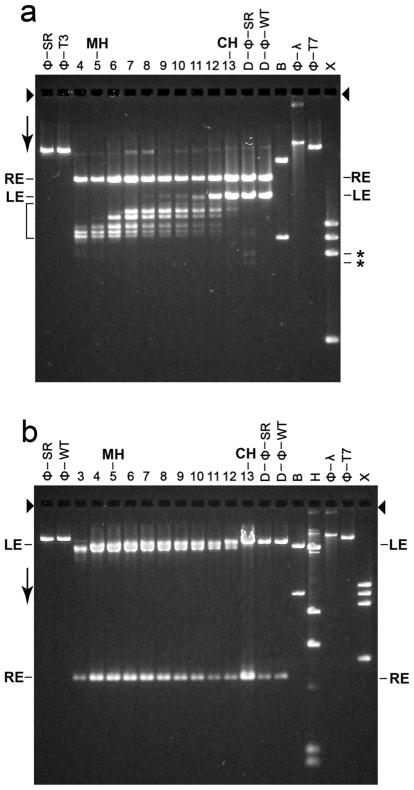
Figure 6.
Restriction endonuclease analysis. Particles in sequential fractions of a sucrose gradient were trimmed with 100 μg/ml DNase I; the sucrose gradient was similar to the one in Figure 3b. Also trimmed were both wild type and T3SR3-1 phages. The DNase I was inactivated and the DNase I-resistant DNA from each sample was purified (Materials and Methods Section). The purified DNA from each DNase I-digested sample was further digested with either (a) restriction endonuclease Bgl II or (b) restriction endonuclease Ava I and then fractionated by gel electrophoresis for (a) 36.0 hr and (b) 24.0 hr. Volumes of samples for the various lanes of Figure 6a (and 6b) were varied to make DNA visible, without overloading. The gels were stained with GelStar. The arrows indicate the direction of electrophoresis; the arrowheads indicate the origins of electrophoresis. The lanes with trimmed DNA from sucrose gradient fractions are labeled at the top with the number of the fraction. The lanes with DNase I-trimmed phages T3SR3-1 and T3 wild type are indicated by D-ϕ-SR and D-ϕ-WT, respectively. Other symbols above lanes: CH, conventional head peak; MH, modified head peak; ϕ-SR, undigested T3SR3-1 DNA; ϕ-WT, undigested wild type T3 DNA; ϕ-T7, undigested wild type T7 DNA; B, restriction endonuclease Bgl II digest of phage T7 mature DNA; H, restriction endonuclease Hind III digest of phage λ mature DNA; X, restriction endonuclease Xba I digest of phage T7 mature DNA. The lengths (Kb) of the band-forming (quantized) DNAs in the bracket-marked region of (a) are the following, based on distance migrated in relation to standards (% of genome missing is in parentheses): 15.4 (3.7), 14.4 (6.3), 13.7 (8.1), 12.3 (11.8), 12.0 (11.2), 11.8 (12.3).

