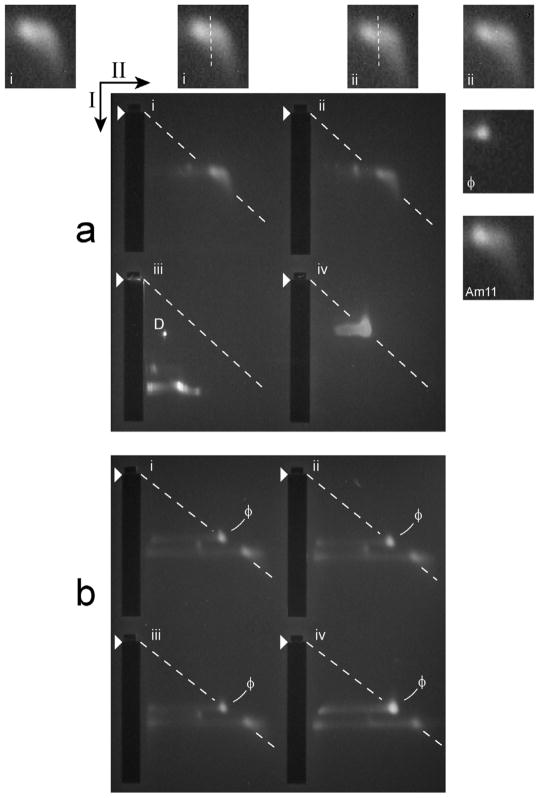
Figure 8.
2d-AGE of DNase I-trimmed heads. (a) Analysis by 2d-AGE (5.0 hr. first dimension; 15.0 hr. second dimension) was performed for modified heads from the MH fraction of a sucrose gradient (the growth medium had 0.4 NaCl) and this was done both before (panel iii) and after digestion with 75 μg/ml DNase I (panel ii) and 200 μg/ml DNase I (panel i). Phage T3 particles were also analyzed (panel iv). (b) 2d-AGE with a 2.4% second dimension gel (7.0 hr. first dimension; 31.0 hr. second dimension) was performed for 200 μg/ml DNase I-digested, modified heads from a sucrose gradient like the one in Figure 3b (the growth medium had 0.4 M NaCl); wild type phage T3 particles were added to the samples for panels i-iii. Arrows indicate the directions of electrophoresis in the first (I) and the second (II) dimensions; arrowheads indicate leading edges of sample wells; ϕ indicates a band of phage particles, used for the dashed line.
Insets in (a) are equally magnified images of the following, labeled at the lower left: (i and ii, outer insets), the skewed bands in Figure 8a, panels i and ii, respectively; (i and ii, inner insets), as in i and ii outer insets, with a visually drawn dashed line that follows a region of decreased density that generates a split-band appearance; (ϕ), un-skewed band of wild type T3 phage; (Am11), skewed band of modified heads from a non-permissive infection by a gene 11 amber mutant.

