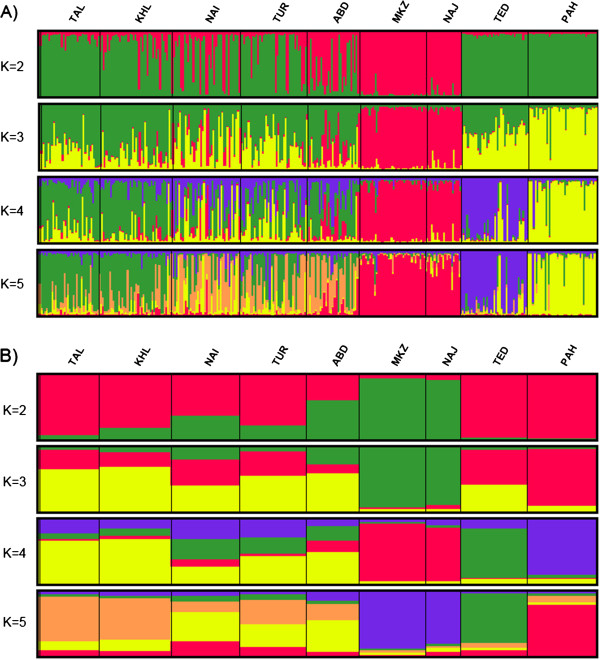
Figure 6.

Clustering assignments of the nine goat breeds obtained by STRUCTURE analyses. Each of the 317 animals is represented by a thin vertical line that is divided into segments the size and color of which correspond to the relative proportion of the animal genome assigned to a particular cluster; breeds are separated by thin black lines. A) Estimated population structure displayed with individual Q-scores. B) Estimated population structure displayed with population average Q-scores.
