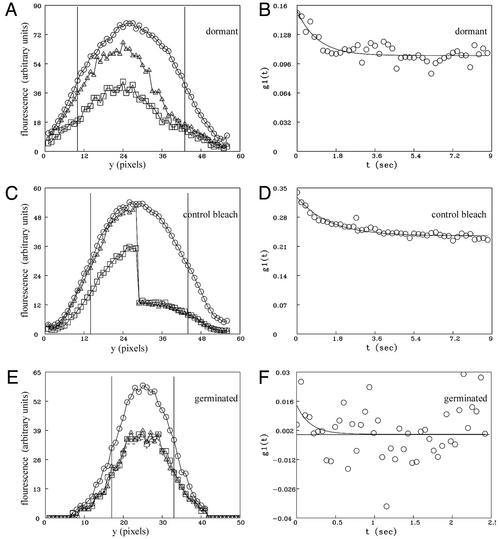
Fig 2.
FRAP of GFP in wild-type dormant and germinated spores of B. subtilis (strain PS3518). (A, C, and E) Fluorescence intensity averaged across the spore along a line drawn down the longest axis of the spore (y) before and after photobleaching. ○, average of five prebleach scans; ▵, first postbleach scan; □, last postbleach scan. The lower values for the last postbleach scan are the result of some photobleaching that occurs during continuous monitoring. Bleaching during monitoring is corrected for in the subsequent analysis (see Methods). The vertical bars show the regions defined as the beginning and end of the spore for the determination of the diffusion coefficient. (B, D, and F) Fits to Eq. 6 from which D and R are derived. (A and B) A representative dormant spore in which half the spore was photobleached. (C and D) The composite results from control spores and include the average of five control dormant spores in which the entire spore was photobleached and five control spores that were not photobleached but were otherwise monitored the same as photobleached spores. Both halves of each spore monitored without bleaching were averaged together and plotted as for the left half of the spore, whereas both halves of the five control spores in which the entire spore was photobleached were average together as the “right” half of the spore. These data then were fitted to Eq. 6, and the results are shown in D. (E and F) A representative germinated spore in which half the spore was photobleached. Redistribution of fluorescence was essentially complete before the first postbleach scan was obtained.

