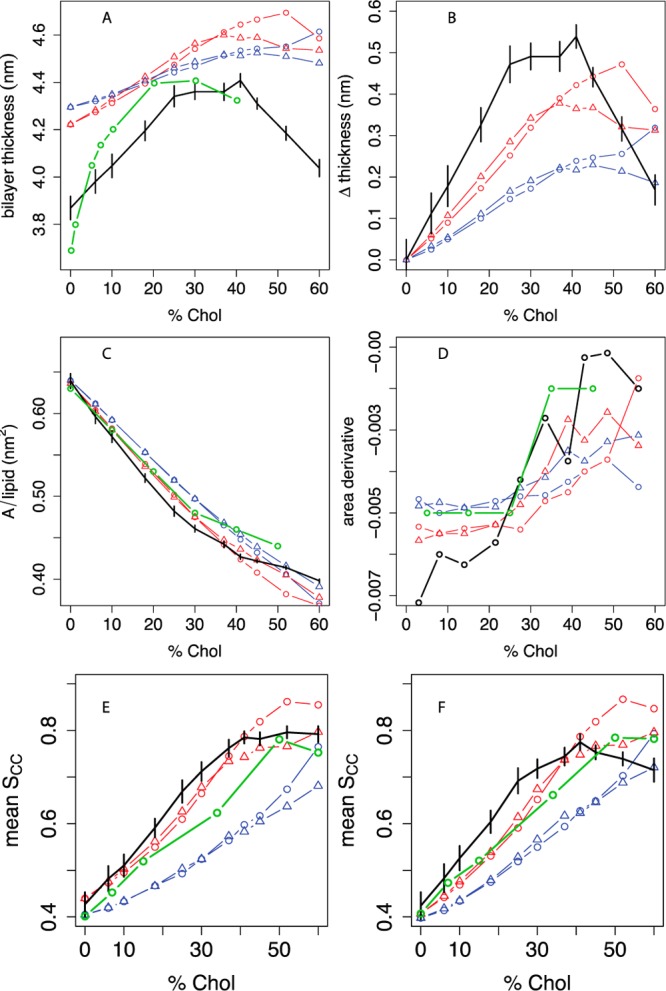
Figure 2.

Thickness, area, and lipid tail order vs cholesterol concentration in POPC bilayers compared between experiment, united-atom, and different coarse-grained simulations. A: Bilayer thickness (phosphate-phosphate distance across the leaflets), averaged over a grid as described in the Methods; experimental headgroup-headgroup distance (dHH) data are given from Hodzic et al.52,53 B: Difference in bilayer thickness from 0% cholesterol. C: Projected area per molecule, with experimental areas in monolayers from Smaby et al. at a surface pressure of 30 mN/m;56 D: estimated slope of the AM curve as a function of mol % cholesterol; the slope between two consecutive Xcholxi and xi+1 is plotted at (xi + xi+1)/2. Panel E shows the C2B-D3B P2 order parameter for the oleoyl chain and panel F shows the C2A-C3A P2 order parameter for the palmitoyl chain. Experimental SCH data from Ferreira et al.43 (see Figure S8) are converted to estimated P2 order parameters based on a linear model relating SCH and P2 calculated from UA simulations, as described in the Methods and Figure S7. For all panels, black indicates the united-atom model.36 For coarse-grained simulations, the phospholipid model is indicated by blue lines (MARTINI) or red lines (angle-corrected POPC), while the sterol model is indicated by circles (MARTINI cholesterol) or triangles (optimized cholesterol, that is, CT3-Me2b). Where available, experimental data are indicated in green. Error bars indicate the standard deviation of each metric over simulation time.
