Figure 5.

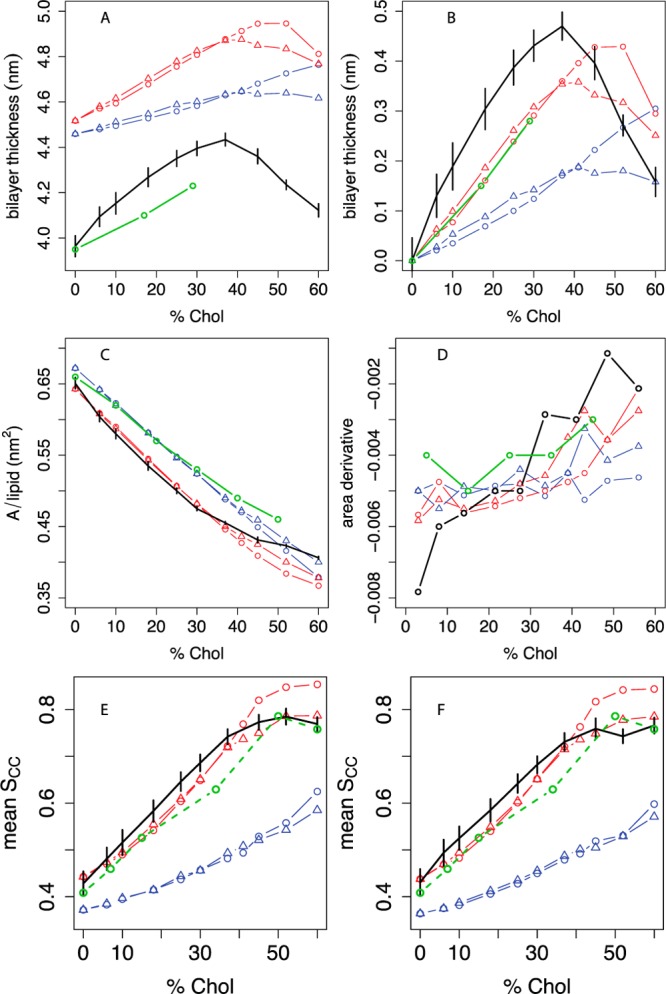
Thickness, area, and lipid tail order vs cholesterol concentration in DOPC bilayers compared between experiment, united-atom, and different coarse-grained simulations. A: Bilayer thickness (phosphate-phosphate distance across the leaflets), averaged over a grid as described in the Methods, with experimental data from Kucerka et al.50 We estimated headgroup-headgroup distances (dHH) from their data by dTOT – dH, where dTOT is the total bilayer thickness measured in their paper and dH = 1.0 nm is the estimated thickness of the headgroup layer.76 B: Difference in bilayer thickness from 0% cholesterol. C: Projected area per molecule, with experimental areas in monolayers from Smaby et al. at a surface pressure of 30 mN/m;56 D: estimated slope of the AM curve as a function of mol % cholesterol; the slope between two consecutive Xcholxi and xi+1 is plotted at (xi + xi+1)/2. Panel E shows the C2A-D3A P2 order parameter for the sn-1 oleoyl chain, and panel F shows the C2B-D3B P2 order parameter for the sn-2 oleoyl chain. For all panels, black indicates the united-atom model.36 The estimated experimental POPC oleoyl chain P2 order parameter data derived from Ferreira et al.43 (Figure 2E) are included in both panels as an approximate experimental reference. For coarse-grained simulations, the phospholipid model is indicated by blue lines (MARTINI) or red lines (angle-corrected POPC), while the sterol model is indicated by circles (MARTINI cholesterol) or triangles (optimized cholesterol, that is, CT3-Me2b). Where available, experimental data are indicated in green. Error bars indicate the standard deviation of each metric over simulation time.
