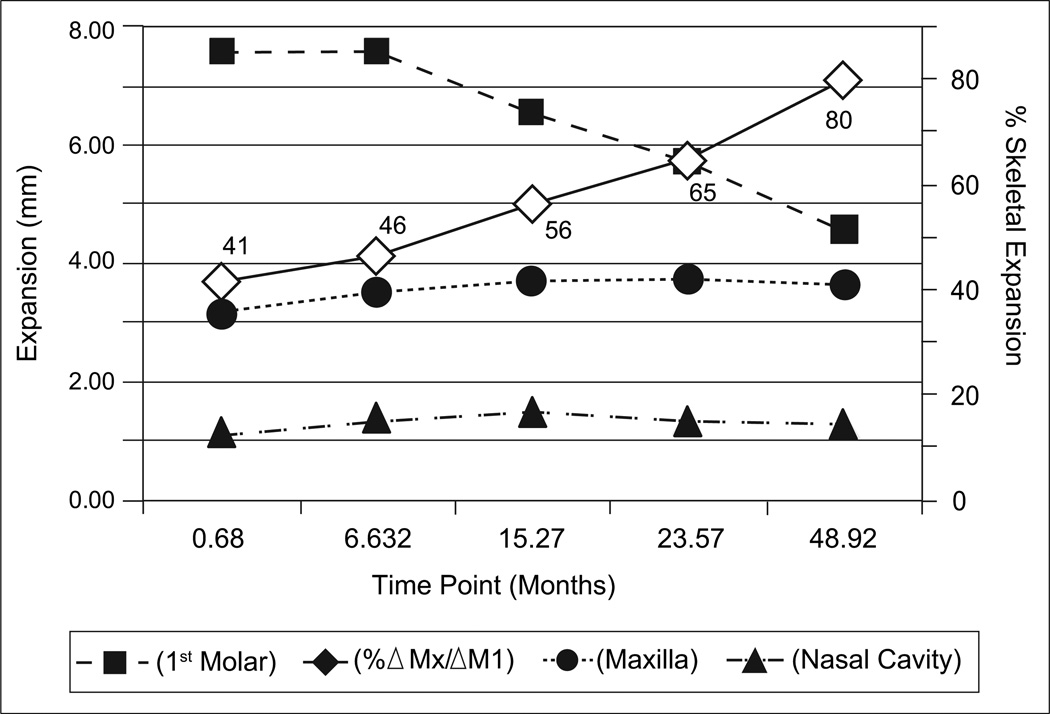
Fig 4.
Changes over time after SARPE in the dental and skeletal dimensions, and in the percentages of skeletal expansion. Almost all relapse was dental rather than skeletal. Repeated-measures ANOVA confirmed a significant relationship between the amount of dental relapse and the time after surgery, when skeletal changes are stable and unaffected by time after surgery. Squares indicate expansion at the first molar. Diamonds indicate percentages of skeletal expansion at each time point. Circles indicate maxillary skeletal expansion. Triangles indicate expansion across the nasal cavity.

